|
Published November 26, 2011
| |||
 | |||
|
The Reit myth busted
Whatever Reits pay out in dividends, they will take back
a few years later in the form of rights issues
By TEH HOOI LING
SENIOR CORRESPONDENT THE high yields of real estate investment trusts (Reits) are tempting. And indeed, they have been touted as a relatively safe and stable instrument to own if one is looking for a steady stream of income. As such, many investors see Reits as a good asset class to have in one's retirement accounts.
Here's what I found. Of the 17 Reits which have a listing history of at least four years on the Singapore Exchange, only three have not had any cash calls or secondary equity raising. The remaining 13 have had cash calls, and many had raised cash multiple times. One had a few rounds of private placement of new units which diluted the stake of existing unitholders somewhat. For many of these Reits, the cash called back far exceeded the cash received. So, the myth of Reits as almost comparable to a fixed income instrument is really busted. Take CapitaMall Trust (CMT) which was listed in July 2002. Assuming that Ms Retiree bought one lot or 1,000 units at the initial public offering (IPO) for a total sum of $960. For the whole of 2003, she received $57 in dividends. However in that year, CMT also had a one-for-10 rights issue. To subscribe for her entitlement, Ms Retiree would have to cough out $107. In 2004, she would received $89 for the total number of CMT units she owned. That year, CMT had another rights issue, also one-for-10. The exercise price was higher at $1.62. To subscribe, Ms Retiree would have to fork out $178. In 2005, CMT again had another fund raising exercise via rights issue. Ms R would pocket $124 in dividends but in that same year, had to return $282 back to the Reit. In the next three years - 2006 to 2008 - Ms Retiree felt rich and happy. She merrily banked in her quarterly distributions which amounted to $404 for her holdings of CMT. Her one lot, after three rights issues, had grown to 1,331 units. In the following year, another $175 was distributed. But CMT wasn't going to let Ms R be happy for long. It launched a big one - a 9-for10 rights issue. To fully subscribe for her entitlement, Ms R had to empty her bank account of a whopping $982. And you know what, the cash call came in March 2009, when the Straits Times Index fell below 1,600 points, and many retirees were dismayed to see their investment portfolios plunge by half or more. Many fret if they would have enough left in the pot to sustain their lifestyle. Having to cough up more money for a Reit was the last thing that they wanted to do! Negative cash flow And here's the final tally. Since its IPO until today, a holder of one lot of CMT would have received $1,264 in cash distributions. However, in all, he or she had to return $1,549 back to the Reit so as to subscribe to their entitlement of new issues. That's a net outflow of $284 per lot. It's the same story with K-Reit Asia, Capitacommercial Trust, Frasers Commercial Trust, Mapletree Logistics, First Reit, Lippo Malls Indo Retail Trust, AIMS AMP CAP and Saizen REIT in that what was taken back from investors was more than what was given out. K-Reit has been one of the most aggressive fund raising Reits. Had you started with just one lot when it was listed in April 2006, you would have to dish out $8,399 to subscribe to your rights issue. Distributions amounted to $1,110, resulting in a net outflow of $7,289. For Reits with at least four years of track record, only Fraser Centrepoint, Parkway Life and CapitaRetail China have not had any cash calls. Instead of a rights issue, Suntec Reit raised funds by issuing new units to some institutional investors at a slight discount. Existing unitholders don't have to cough out additional cash, but they would have their share of earnings diluted somewhat. Misalignment of interests Reits are managed by managers, and managers are paid based on the size of the portfolio that they manage. So the incentive is for the managers to continue to raise money and expand the portfolio size. Sometimes this is not done in the best interest of unitholders. The most recent controversy was over K-Reit's purchase of Ocean Financial Centre (OFC) from its sponsor Keppel Land. K-Reit has launched a 17-for-20 rights issue to pay for the purchase which was deemed by the market to be expensive at a time of uncertain outlook and when office rental is expected to ease. BT reader Bobby Jayaraman argued that rather than be compensated based on factors such as the value of assets, net property income and acquisition fees, Reit managers should be paid based on a combination of growth in distribution per unit and market valuation of the Reit. 'If Reit managers were paid on the basis of distribution per unit and market valuation growth, would K-Reit have bulldozed its way through the OFC acquisition like they have done? 'The day K-Reit announced the OFC acquisition, its stock price fell close to 10 per cent and has continued sliding. Yet, its Reit manager will take home significantly increased management fees while shareholders would have lost a good chunk of their capital even as they bear significantly more risk in the form of higher leverage and potential property devaluations given the uncertain environment,' he wrote to BT. Misalignment of interests aside, there are also unitholders who clamour for growth. But while Reits may not be the perfect income yielding instrument that they are made out to be, they have proven their capacity for capital appreciation. Relative to the capital ploughed in, CapitaMall Trust has rewarded its unitholders with a return of 127 per cent. Most Reits have yielded positive total returns. Instead of buying Reits for yields, some savvy investors only buy them when they see those with good quality assets trade at sharp discounts to their book value. For example in the first half of 2009, CMT was trading at 50 per cent its book value. Today, it is not as cheap. At $1.755, CMT is now trading at 13 per cent premium to its net asset value of $1.55. Hence, valuation metrics which apply to a typical asset heavy stock would apply to Reits as well. | |||
Saturday, 26 November 2011
What I Have Been Saying About REIT for Many Years

New Building Guidelines in Singapore
|
This ruling will make it even more difficult to en bloc terraces and semi-detached homes. It will make it compulsory for almost 100% of terrace owners to agree to a collective sale. Imagine there are 10 units of terraces of 1500 sf each that a developer wants to buy. 9 of them agree and one brokeaway. The combined size of 9 units may be 13,500 sf, enough to make a smallish apartment or condo, but since the single unit is less than 10,000 sf, the deal cannot go ahead.
The second ruling warns us against buying any property below 1.4x plot ratio. Developers generally buy properties at "future" prices and then rebuild into much smaller units, selling them at as much as double the price. This ruling will set a minimum size for redeveloped land with a ratio of 1.4. The scam in the last 5 to 6 years has been this: Developers instead of selling a 1000 sf unit for 1000 psf and get 1m in revenue, break the unit into 2 and sell them for 1800 sf, making them cheaper in quantum at 900k per unit. But the developer earns 1.8m. Only silly Singaporeans and foreigners who are keeping their cash here will do that. Perversely, the Singaporeans may not be that dumb because they know that foreigners will buy anything just to keep their cash here. But think of it this way, if there is another Asian crisis, the foreigners may decide to sell these units at 20% below their cost price. If the rental yield is not high, the price could fall very quickly. This is likened to a house of cards.
I am very curious how the Singapore residential sector will pan out over the next 2 to 3 years. I have some hunches but will keep the cards close to my heart.
Published November 25, 2011
| |||
|
New building guidelines take effect
Guidelines will only affect new applications
By MINDY TAN
A MINIMUM plot size requirement of 1,000 square metres and a guide on the maximum number of dwelling units (DUs) for non-landed residential estates were put into effect by the Urban Redevelopment Authority (URA) yesterday.
In addition, for all breakaway proposals from existing landed housing for either flat or landed housing developments within non-safeguarded landed housing areas, the aggregate land area for the left-behind plots must also satisfy the minimum plot size. The impact of this guideline will be felt particularly in the area of en bloc sales for landed housing, noted Tang Woon Ee, partner at Rodyk & Davidson. Citing the example of a breakaway development for a row of terrace houses, she noted that there have been cases of a plot being redeveloped into a block of apartments, with a small, adjoining landed property. 'This will put a stop to this practice, unless the adjoining piece that doesn't want to take part in the collective sale is of that minimum size of 1,000 sq m,' she said. Separately, a guide on the maximum number of DUs for flat and condominium developments within GPR (gross plot ratio) 1.4 residential estates was introduced. The DU guide is also applicable to residential components of mixed-use developments, within GPR 1.4 residential estates, and other low-rise, low-density residential areas. A more stringent formula was developed for areas such as Telok Kurau Estate, which has seen a rapid injection of a large number of units, resulting in significantly higher traffic volumes along the existing narrow local access roads, noted URA. 'If the number of units are being restricted, on average unit sizes will be larger. For developers looking to achieve the same per square foot pricing, you are looking at a higher total quantum that may or may not be supported by the market,' pointed out Ms Tang. The guidelines will only take effect with respect to new applications, added Ms Tang, noting that any formal applications (excluding outline applications) submitted prior to Nov 24 which had been granted provisional permission or will result in provisional permission being granted will be evaluated under the old guidelines. Kovan and Joo Chiat/Jalan Eunos estates were also identified as potentially problematic clusters. URA and the Land Transport Authority are conducting a joint study to determine if more stringent DU guides are required based on the infrastructural capacity of the area. The study is expected to be completed by the third quarter of 2012.  | |||

Wednesday, 23 November 2011
Tactical Asset Allocation and Trend Following
I am a huge fan of trend following, because I believe that all asset classes inevitably form a trend, whether up or down. The ability to long or short risk assets is important, as with the ability to control risk and not over leverage.
Revisiting A Quantitative Approach To Tactical Asset Allocation: Good Returns In Reach
November 20,
2011
In May 2006, Mebane Faber published "A Quantitative Approach to Tactical Asset Allocation," (pdf)
which has become a seminal favorite in the area of active portfolio management.
The paper demonstrated how a simple quantitative method of using a 10-month
simple moving average (SMA) could improve the risk-adjusted returns over several
asset classes.
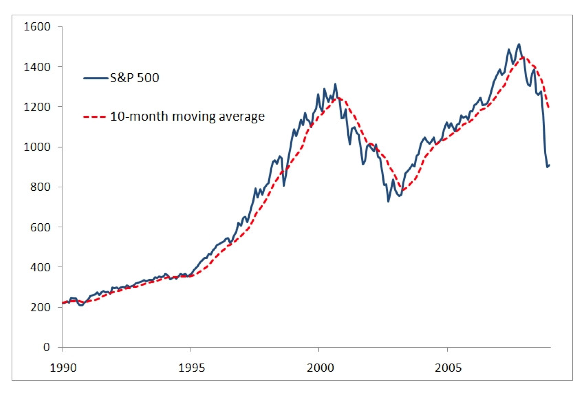
The methodology used in the study was to buy when the monthly price was greater than the 10-month SMA and to sell and move to cash when the price was less than the 10-month SMA.
Click to enlarge
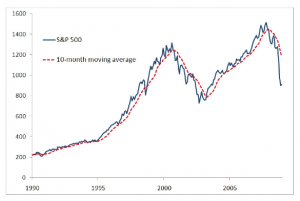
This chart demonstrates the use of the 10-month SMA with the S&P 500. Mr. Faber also applied the same methodology to foreign stocks, REITS, U.S. Government bonds, and commodities.
The conclusions of Mr. Faber's study (see the paper for greater detail) were that risk-adjusted returns were increased almost universally among all asset classes and perhaps most importantly, investors sidestepped protracted market declines. For those who say that there is no value in attempting to time the market, this should prove otherwise.
A few ideas I have wondered about were whether the 10-SMA was indeed the best choice for everyday use and what would happen if we introduced a more robust mixture of asset classes.
On the issue of choosing the period to use for the moving average, the challenge is always finding the period of time that balances between minimizing drawdowns and minimizing short term whipsaw. Shorter moving average periods will reduce the distance that prices have to travel before triggering a "sell," thus reducing the size of the decline, but are more subject to reversals in price that trigger a new signal in the opposite direction. This can create a buzz saw effect of eating capital if one is not careful.
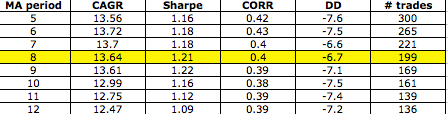
To examine the impact of the moving average time period, I set up a portfolio on ETF Replay with the following four ETFs and one index: SPY, EFA, ICF, IEF, and GTY. The latter is used for the GSCI commodity index as most commodity ETFs have not been around long enough to create a valid study. Using the same rules as in Meb Faber's study, I tested the results using different periods for the SMA. For the time period I started at the beginning of 2003 and ran through 10/31/2011. The results are here:

Based upon these results, the 8-month SMA produced the highest Sharpe ratio with only four additional trades when compared to the traditional 10-period SMA. The impact of the longer moving average period is easy to spot as the longer the period, the larger the actual drawdown.
My rationale for introducing additional asset classes was based upon the simple observation that in recent years, the correlation among most of the major asset classes has approached 1.00, implying that diversification by asset class alone has not provided much direct benefit to risk management for investors.
As I considered the five original asset classes within the original study, the thought was that there would be times when the model would be mostly in cash. While this did serve the purpose of protecting capital, it also meant the model would be limited in what it could earn during such periods.
In fact, from August 2008 through May 2009, the basic tactical model was only 20% invested in the IEF ETF (Intermediate Treasury), with the remaining 80% held in cash.
Since I believe that investors should be indifferent to the direction of the market, I next introduced to the model SH, DOG, and EUM (all inverse ETFs). Additionally, I added ETFs such as GLD, ILF, EWJ, EPP, QQQ, SHY and a few additional international ETFs. When finished, I now had 16 ETFs in my model versus the original 5.
So, the next step was to repeat the exact same process - running a backtest using different SMA periods, during the same time period, and recording the results:
The results were what I had hoped for. The backtested results showed in an increase in the CAGR and the Sharpe ratio while seeing a decrease in the maximum drawdown. While the number of ETFs were increased threefold, the number of trades only increased by double. Nevertheless, the number of trades is such (about 24 per year versus 12 in the basic model) that an investor might consider trading the enhanced model only in qualified accounts such as IRAs.
It seems by the test results that by increasing the number of ETFs, especially by adding a few that can make money in a declining market, the more opportunity the model has to earn additional return. This was displayed in both the increased CAGR and Sharpe ratios when compared to the original model.
This prompted me to perform one more test. This time I would focus on reducing the size of the universe but I would include only those ETFs which had low correlation to each other. The resulting basket contained two inverse ETFs, gold, corporate bonds, short term treasuries, U.S. stocks, foreign stocks, and emerging markets.
Using the 8-month SMA for my test, I obtained the following results:
What this tells me is that when investors are seeking ways to diversify their portfolio, it may be as simple as using the tools they already have available but in a new way. By using a systematic, unemotional, model-based approach, I find that it is not that difficult to keep a portfolio earning the types of returns that most investors require in order to reach their financial goals.
The methodology used in the study was to buy when the monthly price was greater than the 10-month SMA and to sell and move to cash when the price was less than the 10-month SMA.
Click to enlarge
This chart demonstrates the use of the 10-month SMA with the S&P 500. Mr. Faber also applied the same methodology to foreign stocks, REITS, U.S. Government bonds, and commodities.
The conclusions of Mr. Faber's study (see the paper for greater detail) were that risk-adjusted returns were increased almost universally among all asset classes and perhaps most importantly, investors sidestepped protracted market declines. For those who say that there is no value in attempting to time the market, this should prove otherwise.
A few ideas I have wondered about were whether the 10-SMA was indeed the best choice for everyday use and what would happen if we introduced a more robust mixture of asset classes.
On the issue of choosing the period to use for the moving average, the challenge is always finding the period of time that balances between minimizing drawdowns and minimizing short term whipsaw. Shorter moving average periods will reduce the distance that prices have to travel before triggering a "sell," thus reducing the size of the decline, but are more subject to reversals in price that trigger a new signal in the opposite direction. This can create a buzz saw effect of eating capital if one is not careful.
To examine the impact of the moving average time period, I set up a portfolio on ETF Replay with the following four ETFs and one index: SPY, EFA, ICF, IEF, and GTY. The latter is used for the GSCI commodity index as most commodity ETFs have not been around long enough to create a valid study. Using the same rules as in Meb Faber's study, I tested the results using different periods for the SMA. For the time period I started at the beginning of 2003 and ran through 10/31/2011. The results are here:
Based upon these results, the 8-month SMA produced the highest Sharpe ratio with only four additional trades when compared to the traditional 10-period SMA. The impact of the longer moving average period is easy to spot as the longer the period, the larger the actual drawdown.
My rationale for introducing additional asset classes was based upon the simple observation that in recent years, the correlation among most of the major asset classes has approached 1.00, implying that diversification by asset class alone has not provided much direct benefit to risk management for investors.
As I considered the five original asset classes within the original study, the thought was that there would be times when the model would be mostly in cash. While this did serve the purpose of protecting capital, it also meant the model would be limited in what it could earn during such periods.
In fact, from August 2008 through May 2009, the basic tactical model was only 20% invested in the IEF ETF (Intermediate Treasury), with the remaining 80% held in cash.
Since I believe that investors should be indifferent to the direction of the market, I next introduced to the model SH, DOG, and EUM (all inverse ETFs). Additionally, I added ETFs such as GLD, ILF, EWJ, EPP, QQQ, SHY and a few additional international ETFs. When finished, I now had 16 ETFs in my model versus the original 5.
So, the next step was to repeat the exact same process - running a backtest using different SMA periods, during the same time period, and recording the results:
The results were what I had hoped for. The backtested results showed in an increase in the CAGR and the Sharpe ratio while seeing a decrease in the maximum drawdown. While the number of ETFs were increased threefold, the number of trades only increased by double. Nevertheless, the number of trades is such (about 24 per year versus 12 in the basic model) that an investor might consider trading the enhanced model only in qualified accounts such as IRAs.
It seems by the test results that by increasing the number of ETFs, especially by adding a few that can make money in a declining market, the more opportunity the model has to earn additional return. This was displayed in both the increased CAGR and Sharpe ratios when compared to the original model.
This prompted me to perform one more test. This time I would focus on reducing the size of the universe but I would include only those ETFs which had low correlation to each other. The resulting basket contained two inverse ETFs, gold, corporate bonds, short term treasuries, U.S. stocks, foreign stocks, and emerging markets.
Using the 8-month SMA for my test, I obtained the following results:
- CAGR: 10.42% vs. 5.42% for the S&P 500
- Sharpe: 1.12
- S&P 500 correlation: 0.16
- Maximum drawdown: -4.3% vs. -50.8% for the S&P 500
- Number of trades: 84
What this tells me is that when investors are seeking ways to diversify their portfolio, it may be as simple as using the tools they already have available but in a new way. By using a systematic, unemotional, model-based approach, I find that it is not that difficult to keep a portfolio earning the types of returns that most investors require in order to reach their financial goals.
Sunday, 20 November 2011
Why It Is Important to Keep Democracy Alive
I've always been chided for airing my views about the importance of checks and balances here. "Why bother to vote? It's already very good here." "How can we betray the government who has done so much for us?" "We have the best people leading us, we don't need a thriving opposition." I agree that we have a world class government, a great leader who brought us from the swarms of third world to become a world class city. We have come a long way. If I had been born in Malaysia, Thailand or China, or even Taiwan or South Korea, I would not have had the same opportunities.
But history counts little towards our efforts to make our nation state even better. The government needs to be more responsive to the needs of the people that are reasonable. Laws must be tweaked to be more just. More checks and balances must be in place to ensure that no one person will become so powerful in future that he is above the law. The push to democratise must continue. Our system will evolve our way, not necessarily mirrored after the west.
I like the Gettysburg Address because it encapsulates the spirit of the Americans that made them the greatest nation for over 150 years. Here it is again.
The Gettysburg Address
Four score and seven years ago our fathers brought forth on this continent, a new nation, conceived in Liberty, and dedicated to the proposition that all men are created equal.
Now we are engaged in a great civil war, testing whether that nation, or any nation so conceived and so dedicated, can long endure. We are met on a great battlefield of that war. We have come to dedicate a portion of that field, as a final resting place for those who here gave their lives that that nation might live. It is altogether fitting and proper that we should do this.
But, in a larger sense, we cannot dedicate—we cannot consecrate—we cannot hallow—this ground. The brave men, living and dead, who struggled here, have consecrated it, far above our poor power to add or detract. The world will little note, nor long remember what we say here, but it can never forget what they did here. It is for us the living, rather, to be dedicated here to the unfinished work which they who fought here have thus far so nobly advanced. It is rather for us to be here dedicated to the great task remaining before us—that from these honored dead we take increased devotion to that cause for which they gave the last full measure of devotion—that we here highly resolve that these dead shall not have died in vain—that this nation, under God, shall have a new birth of freedom— and that government of the people, by the people, for the people, shall not perish from the earth.
Seasonality of Stock Markets
Seasonality is a characteristic of a time series in which the data experiences regular and predictable changes which recur every calendar year. Any predictable change or pattern in a time series that recurs or repeats over a one-year period can be said to be seasonal.
This is different from cyclical effects, as seasonal cycles are contained within one calendar year, while cyclical effects (such as boosted sales due to low unemployment rates) can span time periods shorter or longer than one calendar year.
For the Singapore stock market, I have done a seasonality study, showing which months are more bullish and bearish. Contrary to popular belief, October is actually a rather bullish month. Of course,
the diagram below is just the tip of the iceberg for my seasonality studies.

Some key points to note: the best months for being LONG are April, November and December, while the best months for being SHORT are June, August and September.
There are many other patterns (some less obvious) which could have a significant impact on the stock market. Although your trading decisions should not be based solely on these, they can act as a powerful confirming indicator, or help you adjust your position-aggressiveness.
This is different from cyclical effects, as seasonal cycles are contained within one calendar year, while cyclical effects (such as boosted sales due to low unemployment rates) can span time periods shorter or longer than one calendar year.
For the Singapore stock market, I have done a seasonality study, showing which months are more bullish and bearish. Contrary to popular belief, October is actually a rather bullish month. Of course,
the diagram below is just the tip of the iceberg for my seasonality studies.
Some key points to note: the best months for being LONG are April, November and December, while the best months for being SHORT are June, August and September.
There are many other patterns (some less obvious) which could have a significant impact on the stock market. Although your trading decisions should not be based solely on these, they can act as a powerful confirming indicator, or help you adjust your position-aggressiveness.
Thursday, 17 November 2011
Watch for Buybacks
There are about 30 exchange-traded funds focused on dividend-paying stocks, but only two focused on stocks that buy back their own shares. While academics might claim that investors should be indifferent between stocks that pay a dividend and those that buy back shares, fund providers know that investors like the allure of dividend funds. But there is good reason to pay attention to firms that reduce their shares outstanding.
 International Business Machines
(IBM), Intel
(INTC), Pfizer
(PFE), Wal-Mart Stores
(WMT), and Verizon Communications
(VZ) were among the top repurchases, but so was Hewlett-Packard
(HPQ), which dramatically reduced its share count only to see its share price fall further. Bank of America
(BAC) and Alcoa
(AA) were among the largest issuers of new shares.
International Business Machines
(IBM), Intel
(INTC), Pfizer
(PFE), Wal-Mart Stores
(WMT), and Verizon Communications
(VZ) were among the top repurchases, but so was Hewlett-Packard
(HPQ), which dramatically reduced its share count only to see its share price fall further. Bank of America
(BAC) and Alcoa
(AA) were among the largest issuers of new shares.Sunday, 13 November 2011
Trading Opportunities Avail, But the Bear Prevails
Is the rally that commenced on oct 4, 2011 a bear market rally?
Definition of a Bear Market Rally:
1. General stock market decline of 20% or more, from peak to trough. Note that there will always be false alarms such as in Apr to Aug 2010.
2. Bear market rally is a significant advance of indices 10 - 25% from trough to peak following a bear market decline that fails to break above previous peak and/or sustain over the peak for 10 or more consecutive trading days.
3. If the decline was very steep, e.g. > 25%, and a rally of 33.3% occurs and is sustained for at least 10 consecutive trading days, then it is not a bear market rally. Similarly, a 30% decline will require an advance of 42.9%.
4. After failing to capture and/or sustain the previous peak, stock indices must fall and penetrate the previous trough within a timeframe. This must occur within a time frame not to exceed 2x the amount of time that elapsed between the original peak and original trough. For e.g. the S&P500 peaked on 2 May (1371) and fell to a low on 4 Oct (1075). This took about 5 months to pan out. Hence, by Aug 2012, we should see a break below the previous low of 1075.

Character of Market Action
Definition of a Bear Market Rally:
1. General stock market decline of 20% or more, from peak to trough. Note that there will always be false alarms such as in Apr to Aug 2010.
2. Bear market rally is a significant advance of indices 10 - 25% from trough to peak following a bear market decline that fails to break above previous peak and/or sustain over the peak for 10 or more consecutive trading days.
3. If the decline was very steep, e.g. > 25%, and a rally of 33.3% occurs and is sustained for at least 10 consecutive trading days, then it is not a bear market rally. Similarly, a 30% decline will require an advance of 42.9%.
4. After failing to capture and/or sustain the previous peak, stock indices must fall and penetrate the previous trough within a timeframe. This must occur within a time frame not to exceed 2x the amount of time that elapsed between the original peak and original trough. For e.g. the S&P500 peaked on 2 May (1371) and fell to a low on 4 Oct (1075). This took about 5 months to pan out. Hence, by Aug 2012, we should see a break below the previous low of 1075.

5. A Major Reversal is deemed to have occured (as opposed to a continuation of a bear) if both the bear market decline and the recovery that exceeds the previous peak are "confirmed" by general market movements in which the S&P500, DJI, NASDAQ, Russell 2000 and Wilshire 5,000 ALL participate fully in the criteria set out above.
How to Recognise a Bear Market Rally
Bear market rallies are like bottoms; you can only know for sure that they occured in retrospect. The challenge is to be able to identify the characteristic of a bear market rally as one that is occuring so as to not get lured into one.
The characteristics of a bear market rally are:
1. Fundamentals continue to deteriorate.
In a bear rally, the fundamental forces that led to the initial decline still exists and are deteriorating beyond the level that was seen during the trough. Stocks often rally on relatively insignificant news during a bear market rally. Despite the positive sentiment of late brought on by the ECB buying Italian bonds, the latest economic data from the largest economies shows no signs of improvement.
2. Sharp, relatively low volume advance.
Extremely sharp advances on relatively low volume, driven by purchases by short sellers, put buyers and call sellers that are aggressively executing stop-loss orders. This is indicative of investor behavior driven by emotion rather than carefully considered fundamental and technical criteria. Behavior such as desire amongst traders and investors to "not miss out" on a rally. The rally in the last month was accompanied by smaller volumes than the sudden decline seen in early Aug 2011.
3. Sentiment recovers to extreme highs prior to recovery of prices.
If sentiment indicators show extremely high levels of bullishness and/or extremely low levels of bearishness, this is an indication that the rally may not penetrate the prior highs.
Fundamentals
The stock market decline between May 2 and Oct 4 was premised on fears of a significant global economic slowdown or recession. 2 exogenous factors drove the decline in stock prices. The first factor was a potential economic and financial crisis in Europe. The second factor was a deterioration of fiscal situation in the US beyond tolerable levels due to political dysfunction. Both drivers are still in play.
For the crisis in Europe a catastrophic economic and financial crisis in Europe appears more likely today than it did on Oct 4.
For the US fiscal situation, little has changed. US leaders seem just as far from reaching any sort of acceptable compromise as they were on Oct 4.
GDP and economic activity data may have been better than expected on 4 Oct. However, it is clear that the general trajectory of economic activity and earnings data is significantly down with respect to where expectations were at the peak on May 2.
The threat to the US economy that caused the original decline was never endogenous. the threats were always exogenous ni the form of political inaction on the fiscal front and the crisis in Europe.
Over 30% of SUP sales came from non-US sources and roughly 50% of net earnings. It is important to note that global growth prospects have deteriorated substantially since Oct 4. Even if the US economy manages to tread water, or even exceed current expectations in terms of growth, the severe deterioration abroad can drive down earnings expectations very substantially and serve as the fundamental basis for new equity market lows.
Hence, a sustained recovery above previous highs is not likely. To the contrary, all these factors combined suggest a net deterioration of fundamental factors since Oct 4. Thus new lows are a strong possibility.
Character of Market Action
The advance from the lows on Oct 4 has been extremely sharp. It has been characterised by large "air pockets" and low volume. One measure of vulnerability of the advance has been the swiftness and intensity of pullbacks, as the "air pockets" left behind are filled.
A 50% retracement (1183 on S&P500) of the most recent countertrend high to the trough would offer another strong signal that the recent recovery will ultimately be categorised as a bear market rally. What might change my view regarding the relation between the character of market action and the probability that the current advance is merely a bear market rally?
For example, if the market did a sufficient amount of backfiling and successful testing of key technical levels, the advance would become solidified. Furthermore to the extent that the advance were to become supported by rising volume and broader-based participation, this would suggest a stronger base from which the rally could sustain itself.
Sentiment & Market Psychology
Rallies typically must climb a wall of worry. In particular, after substantial bear market declines, rallies are fueled by a reversal of pessimism and skepticism. If there is no more pessimism and skepticism to reverse, the rally will tend to peter out.
Some analysts have stated that the sentiment indicators that track the level of equity exposure recommended by the newsletter advisors, that the massive increase in bullishness since Oct 4 low has been too great and the decrease in bearishness has been too rapid for the current advance to be sustained. The widely followed bull/bear ratio in the AAII sentiment survey tends to confirm the analysts' view.
Other indicators tell a different story. Implied volatility and other measures of risk aversion indicate a great deal of residual fear and hesitation on the part of investors. Further, even if investor survey sentiment is bullish, this does not mean that asset allocations have had time to adjust to reflect such new-found bullishness.
Thus, despite bullish sentiment data, I believe that investors on aggregate are positioned quite defensively. I believe that they are positioned less defensively than they were on Oct 4 for sure. But I also think that they are still positioned much more defensively than they were on May 2. This suggests that if good news were for whatever reason forthcoming, the stock market could rally significantly - potentially beyond the May 2 highs.
I don't believe that the third characteristic of a bear market rally can be applied to the present case. To the contrary, I believe that this factor suggests that the market has significant upside potential in the short term if news flow is favorable - so much so that a test of the 1,371 is not out of the question on this basis.
What might change my view? Stubborn persistence of bullish sentiment in the midst of pullbacks would be a warning sign. Furthermore, evidence that the equity weightings of institutional investors and/or individuals had equaled or surpassed weightings on May 2 would also trigger a warning signal.
Conclusion
On balance the evidence points to a high probability that the advance since Oct 4 will be viewed in retrospect as a bear market rally. Overall, fundamental trends and fundamental risks have deteriorated significantly beyond what they were on Oct 4. Further, the very sharp and low-volume character of the recovery off the Oct 4 lows has been quite typical of bear market rallies. For these reasons, it is my view that investors should avoid being lured in by this recent advance. It is most likely a bear market rally.
I believe that within the next six months, the stock market will initiate a leg down that will penetrate the recent 1075 low on the S&P500 and ultimately take the index to a region between 950 and 1020.
For this reason, I believe that all but the shortest-term traders should refrain from attempting to play the equity market on the long side through individual stocks or equity market proxies such as SPDR S&P 500 ETF Trust (SPY), DJIA ETF Trust (DIA) or Powershares Nasdaq 100 Index Trust (QQQ). I believe that investors with longer time horizons should raise cash and avoid purchasing or holding otherwise attractive equities such as Apple (AAPL), Microsoft (MSFT) and Pepsi (PEP).
Having said all these, bearish investors and traders should not become overly confident regarding the prospects of a decline. Persistently high levels of risk aversion and generally defensive positioning of investors mean that good news on any of the key fronts - i.e. Europe and/or the US fiscal situation - could fuel substantial rallies.
If investors want to know what would cause my current outlook to change - in either a bullish or bearish direction - they can review the fundamental, technical and psychological criteria outlined in this article and my interpretation of these factors in prior articles. To the extent that any of these factors change, I will change my views accordingly.
Friday, 11 November 2011
Am I Too Bearish?
Some people criticise me for being too bearish. I don't think I am. I am "suitably" bearish, or cautiously optimistic. Why?
What if I'm bearish, tell my clients to switch to investment grade bonds, CTAs and gold, and risk assets fall 30%? My clients' portfolios will rise between 5 - 20%. I would have made money for them.
What if I'm bearish and I'm wrong; risk assets shot up by 20% and I missed it? Well, with the current cautious asset allocation, my clients' portfolios would still be up by between 2 - 10%. Would that be a great crime? They can always chase returns once a bull run is identified.
Now what about those naysayers who like to gamble with other people's money? What if they go aggressive and turned out to be right? Then good for them. Their clients' portfolios would have been hopefully up 10 - 30% if they bought the right products.
But what if they are wrong and risk assets do indeed tumble 30%? Greece and Italy experienced disorderly defaults? Their portfolios would have been down by 20 - 40% and it would take between 25% and 60% to breakeven. It would have been a painstaking climb back.
So I think I'm doing the right thing by being very conservative now. I've done my return risk calculations and I believe it's the right direction to veer.
Thursday, 10 November 2011
High Chance of Banking Crisis by End Nov 2011
65% Chance of Banking Crisis by End November: Think Tank
Published: Wednesday, 9 Nov 2011 | 6:48 AM ET
By: Patrick Allen
CNBC EMEA Head of News
CNBC EMEA Head of News


There is a 65 percent chance of a
banking crisis between November 23-26 following a Greek default and a run on the
Italian banking system, according to analysts at Exclusive Analysis, a research
firm that focuses on global risks.
 |
|
M. Lorden | Taxi
| Getty Images
A domino effect on banks is 65% likely following a Greek
default and a run on the Italian banking system according to analysts
|
Having tested a number of
assumptions in a scenario modeling exercise, the Exclusive Analysis team warned
it is becoming less and less likely that EU leaders will simply “muddle through”
and have made some bold calls with clear timelines on when the euro zone will be
thrown into a major financial crisis.
The most likely outcome according
to their analysis is a sudden crisis in which the US, UK and BRICs
nations
![[cnbc explains]](http://media.cnbc.com/i/CNBC/Sections/News_And_Analysis/_News/_CNBC_EXPLAINS/_IMAGES/CNBC_explains_icon1.gif) refuse to provide funding via
the IMF for the euro zone. In a world where predictions are made with no time
lines, the paper makes some bold predictions which can be held to account over
the next three weeks.
refuse to provide funding via
the IMF for the euro zone. In a world where predictions are made with no time
lines, the paper makes some bold predictions which can be held to account over
the next three weeks.
In the worst case scenario,
Exclusive Analysis expects the governments of Greece and Portugal to collapse
due to a lack of consensus on how to handle the debt crisis leading to social
unrest. German opposition to handing more funds to the EFSF
rises, leading Germany’s
parliament to actually reduce the money available to the bailout fund.
“In face of that, China and the
other BRICs give clear signals that
they will not support the bailout fund. The EFSF turns
to the ECB
, which refuses to print out
the amount of money the former needs to bailout the PIIGS. In face of the EU's
failure to boost the EFSF, the European banks refuse to accept the 50 percent
haircut on the Greek debt. Both the IMF
and the ECB suspend payments to
Greece,” said the report released on Tuesday evening.
Between November 18-22, French
debt, under Exclusive Analysis' most likely scenario, is downgraded leading to
the interbank lending market freezing up with new governments in Greece and
Italy “faced down by protestors in their attempts to implement more
austerity”.
Civil unrest follows in Spain
following the
election of a new government which pushes through even tighter austerity
measures, and Portugal announces it cannot meet
financial targets putting its bailout cash from the IMF and ECB at risk.
“Increased fear that these
economies will default creates bank runs in Greece and Portugal and
a
downgrade of French sovereign debt from AAA to AA.
EFSF is subsequently downgraded to AA+” said the report.
“The spreads applied to the debt
of all PIIGS increase with yields on Italian bonds
reaching 7.3 percent. In a second contagion
effect, depositors in Spain and Italy fear a banking crisis in their own
countries, which end up creating a series of bank runs and a collapse of the
interbank credit market as banks know that most of their counterparts are at
risk. Greece defaults.”
This doomsday scenario comes to a
head between November 23-26 when Greece leaves the euro to print money and
rescue its banking sector. The new currency falls quickly and depositors lose
out as their investments are converted into the new local currency.
“The government default on the
sovereign debt
and the banks default on their
foreign debt, which causes a banking crisis across Europe. Italian bond yields
rise and exceed 7 percent and the country faces bank runs, in face of which the
government freezes deposits and defaults on the sovereign debt”.
So far so scary. For those looking
for some hope, the Exclusive Analysis report predicts a 25 percent chance that
the EU will continue to muddle through. In this scenario new
politicians in Greece, Italy and Spain are given some
breathing room by voters to find new solutions to the crisis until the end of
the year. Portugal still fails to meet its fiscal targets, putting its bailout
cash at risk, and French debt is still downgraded on prospect of Greek debt
default.
“However, the new governments in
Italy, Spain and Greece are given a honeymoon period by protestors and euro zone
counterparts, which prevents a market rout.”
In January and February, Greece
defaults but the fallout is contained as a new deal on 70 percent haircuts is
agreed. Spanish and Italian bond yields hit 7 percent.
“Civil disorder continues in
Portugal and Spain, reducing their ability to implement austerity packages.
Sovereign ratings in Spain and Italy are downgraded and the prospect of rescue
feels imminent as far as analysts are concerned,” warns the report in its
muddle-through scenario.
“However, the UK and US
governments reduce their objections to the use of IMF resources to fund the
EFSF, which, together with a Greek default, improves market conditions and halts
the rise in yields on the Italian and Spanish debts.”
With Spain and Italy entering IMF
programs, the debt crisis rubbles on in 2012 and 2013 before things turn nasty
as Greece defaults and recreates the drachma.
“Markets close to Italy and
Portugal again towards end-2012 and civil unrest resume, starting off a second
cycle of crisis and speculation about the future of the euro zone.”
If that is the muddle-through
scenario, then we are in for a very nasty end to 2011 and years of euro zone
debt crisis. But Exclusive Analysis does predict a 10 percent chance that the
crisis is resolved.
In this good news scenario
Greece still defaults before the end
of the year, but “stronger political leadership in
other PIIGS contains the fallout”.
“New governments in Italy, Spain
and Greece are given a honeymoon period by protestors as they attempt to
implement more austerity; a real sense of national unity is constructed with
respect to the crisis.”
The new governments are seen as
more credible and the US, UK, IMF and BRICs agree to make more funds available
to the EFSF.
“The new ECB head is persuasive of
the need for the ECB to purchase more bonds from national governments. Greece
defaults in November, but under the new technocratic government the process is
orderly and banks agree to accept 70 percent haircut on their credit. France
recapitalizes its banks and suffers a sovereign downgrade,” said the report.
In the first two months of 2012
France and Germany reach an accommodation on ECB lending and fiscal rules which
means the ECB becomes a lender of last resort in return for statuary limits on
the amount the so-called PIIGS can borrow, a condition demanded by Germany.
“Market conditions improve and
PIIGS bond yields decrease following these successful negotiations. Italy and
Spain are emboldened by their lower yields and by the Franco-German pressure to
negotiate a restructuring of their debt with creditors with a view to smoothing
and lengthening the maturity profile.”
Exclusive Analysis will join
Worldwide Exchange at 10:10 BST/5:10 ET to discuss the report and will be joined
on set by Jim Rogers of Rogers Holdings.
© 2011 CNBC.com
Wednesday, 9 November 2011
Why Bond Yields of Italy is Shooting Up


BNP Paribas, France’s biggest bank, booked a loss of 812 million euros ($1 billion) in the past four months from reducing its holdings of European sovereign debt, while Commerzbank took losses as it cut its Greek, Irish, Italian, Portuguese and Spanish bonds by 22 percent to 13 billion euros this year.
Banks are selling debt of southern European nations as investors punish companies with large holdings and regulators demand higher reserves to shoulder possible losses. The European Banking Authority is requiring lenders to boost capital by 106 billion euros after marking their government debt to market values. The trend may undermine European leaders’ efforts to lower borrowing costs for countries such as Greece and Italy, while generating larger writedowns and capital shortfalls. (Me: It's a Catch 22 situation. There's no escape. EFSF now has to buy up most of the PIIGS bonds. The bond vigilantes initiate the selling, banks will do the rest. After all, if the private sectors are forced to take a 50% "voluntary hair-cut", would they risk holding on to PIIGS' bonds?)
“European regulators and leaders are shooting themselves in the foot because a big investor group for sovereign bonds has been taken out of the market,” said Otto Dichtl, a London-based credit analyst for financial companies at Knight Capital EuropeLtd. “The downward spiral will continue until policy makers find a back-up solution for the sovereigns.”
Barclays, RBS
European banks cut their foreign lending to the Greek public sector to $37 billion as of June 30 from $52 billion at the end of 2010, according to the most recent data from the Bank for International Settlements. European banks’ lending to the Irish, Portuguese and Spanish public sectors also fell, according to Basel, Switzerland-based BIS.Financial companies can reduce risk through writedowns, sales and hedges, as well as by letting bonds mature.
Barclays Plc (BARC), the U.K.’s second-largest bank by assets, said on Oct. 31 that it cut sovereign-debt holdings of Spain, Italy, Portugal, Ireland and Greece by 31 percent in three months. Royal Bank of Scotland Group Plc (RBS), Britain’s biggest state-controlled bank, said on Nov. 4 that it reduced central-and local-government debt of those countries to 1.1 billion pounds ($1.8 billion) from 4.6 billion pounds at year-end.
Italian Yields Climb
Greek bonds have dropped 42 percent since July, the most among 26 sovereign-debt markets tracked by Bloomberg/European Federation of Financial Analysts Societies indexes. Italian debt declined 8 percent and Portuguese securities 5 percent, the indexes show.Italian benchmark yields climbed to a euro-era record yesterday on concern that the region’s third-largest economy will struggle to manage its debt as growth stagnates.
European banking stocks rose 2.4 percent today as investors awaited a vote on Italy’s budget that may show whether Prime Minister Silvio Berlusconi has enough support in parliament to stay in power. The Bloomberg Europe Banks and Financial Services Index, which tracks 46 stocks, has fallen 30 percent this year.
European leaders are demanding that banks raise capital to increase their resilience after firms represented by the Institute of International Finance agreed last month to accept a 50 percent loss on Greek sovereign holdings to help tackle the debt crisis. Policy makers also announced plans to boost the region’s rescue fund to 1 trillion euros.
The EBA examined how much capital the region’s biggest lenders would need to reach a core Tier 1 ratio of 9 percent by the middle of next year after marking their sovereign holdings to market, an exercise omitted during bank stress tests in July. Most major European countries’sovereign debt was considered risk-free in the past. (Me: This is where the proverbial shit hits the fan because MF Global may be the start of a global financial meltdown. Jefferies may be next. Many banks that trade the PIIGS bonds may be forced to cut loss and lend less to raise capital. Bank staff may be let off. This may trigger a recession).
‘Damp Squib’
“The recapitalization of European banks is also turning out to be a damp squib,” according to a Nov. 6 note from CreditSights Inc. “This does nothing to fix the main problem of restoring sovereigns’ risk-free status.”Forcing Europe’s lenders to boost capital based on sovereign markdowns “will cause a number of serious problems,”the IIF, a Washington-based group representing more than 450 financial firms, warned in a letter to French President Nicolas Sarkozy before last week’s Group of 20 summit in Cannes, France.
“The market value of the debt of the countries most under scrutiny is likely to decline further as banks unload sovereign bonds,” according to the letter, signed by Managing DirectorCharles Dallara. “This is contrary to the goal of stabilizing and underpinning the outlook for sovereign debt in Europe.”
An EBA spokeswoman declined to comment.
MF Global
The impact of declining government bond prices spread toNew York on Oct. 31, when MF Global Holdings Ltd. (MF), the holding company for the broker-dealer run by Jon S. Corzine, filed forbankruptcy protection after making a $6.3 billion bet with the firm’s money on European sovereign debt.Moving away from the principle that European sovereign debt is risk free “will come back to haunt us,” Deutsche Bank AG Chief Executive Officer Josef Ackermann said in an interview on Nov. 6 with German ARD television. “That is a very dangerous development.”
Italian banks including Intesa Sanpaolo SpA, the country’s second-biggest, are backing a plan to sell government bonds to individual investors without commissions for a day.
The losses on Greek bonds and efforts to reduce sovereign-debt holdings have hurt banks’ third-quarter earnings.
Commerzbank, Germany’s second-biggest lender, reported a 687 million-euro loss on Nov. 4 after writing down the value of its Greek government debt and selling securities of southern European nations at a loss. Chief Financial Officer Eric Strutzsaid the Frankfurt-based firm booked a “three-digit-million”euro loss on Italian bond sales, without elaborating.
Creating Supply
Strutz, on a conference call with analysts that day, blamed regulators for worsening the situation by including mark-to-market rules in the stress tests, effectively encouraging banks to sell sovereign bonds.“It’s a little bit strange to see that the regulators are actually fueling the whole debate by going into the other direction of creating more supply in the market,” said Strutz.“If you have a mark-to-market, all banks will further sell down their sovereign bonds, because in the end, you need -- whether implicit or explicit -- you need higher capital for that.”
While Commerzbank doesn’t want “a fire sale,” it’s willing to take “a small loss” to free up capital as the lender further reduces sovereign holdings, he said.
Reiner Rossmann, a Commerzbank spokesman, declined to comment beyond Strutz’s statements.
Losses on Debt
Third-quarter profit at BNP Paribas (BNP) fell 72 percent because of a 2.26 billion-euro writedown on Greek sovereign debt and losses from selling European government bonds, the Paris-based bank said on Nov. 3.BNP Paribas, the largest foreign holder of Italy’s bonds, reduced that nation’s debt in its banking book by 8.3 billion euros between the end of June and the end of October, according to a Nov. 3 presentation. Chief Executive Officer Baudouin Protsaid on a conference call with reporters the same day that the Italian bonds were “sold in full on the markets” and not to the European Central Bank.
BNP Paribas said it cut the total sovereign debt in its banking book by 23 percent to 81.5 billion euros.
“We very much reduced our exposure to sovereign debt,”Prot said in a Nov. 3 Bloomberg Television interview. “We incurred losses for that.”
Isabelle Wolff, a spokeswoman for BNP Paribas, declined to elaborate.
ECB Purchases
Societe Generale (GLE) SA, France’s second-largest bank, today reported a 31 percent decline in third-quarter profit because of a writedown on Greek sovereign bonds and lower trading revenue. The Paris-based firm also booked 87 million euros of fixed-income losses from sovereign risks tied to Italy, Spain, Portugal, Ireland and Greece, it said. Societe Generale cut its banking-book sovereign holdings on the five countries to 3.4 billion euros at the end of October from 5.6 billion euros in June.“You can’t really blame BNP or other European banks for selling sovereign debt,” said Christophe Nijdam, an AlphaValue bank analyst in Paris. “The European rescue fund hasn’t enough financial firepower, we still don’t have a rescue fund equipped to make sizeable purchases on the secondary market. As a banker, you don’t want to wait to see what happens for Italy and Spain.”
While it’s difficult to determine who’s buying the bonds, Knight Capital’s Dichtl said that beyond purchases by the ECB, some Greek government bonds may be bought by hedge funds or distressed-asset investors and Italian debt is still being purchased by asset managers and pension funds.
‘Disentangle the Links’
Of about 355 billion euros in outstanding Greek debt, about 127 billion euros is held by the European Union, theInternational Monetary Fund and the ECB, while about 90 billion euros is held by European banks, led by Greek lenders, according to estimates by Open Europe, a research group based in London and Brussels. About 80 billion euros is held by foreign non-banks such as hedge funds and insurers. Data is scarce, making estimates difficult, according to Raoul Ruparel, an economic analyst at Open Europe.In the past, domestic banks in countries such as Greece and Ireland “filled the gap” when foreign demand for their nations’ bonds slipped, said Alberto Gallo, head of European credit strategy at Edinburgh-based RBS.
“The question is how to disentangle the link between banks and sovereigns,” said Gallo, who described the situation as a Catch-22, referring to Joseph Heller’s 1961 novel that describes the no-win situation faced by a World War II pilot trying to avoid duty. “If you do, you have a risk of accelerated de-leveraging. If you don’t, you end up with a bank system very correlated with sovereign bonds and vulnerable to shocks.”
To contact the reporters on this story: Aaron Kirchfeld in Frankfurt at akirchfeld@bloomberg.net; Fabio Benedetti-Valentini at fabiobv@bloomberg.net
Tuesday, 8 November 2011
Talking About Valuations: Ain't That Cheap
Should You Really Care If Stocks Are Cheap?
| November 7,
2011 |
Are stocks cheap right now? Are they expensive? Should you even care?
It's almost axiomatic in this business that investors should buy stocks when they're cheap and avoid them when they're expensive. All of us accept this principle without question, even if we're hardcore technical analysts.
But let me run you through a few charts that may raise some questions about your blind faith in the Price-to-Earnings multiple, the most popular way of measuring value.
What this first chart does is take a snapshot of the market's P/E ratio on January 1, 1900. Then it fast-forwards three years to see how much money you made or lost if you made an investment in the Dow. Those two pieces of data become one little dot on our scatter point chart. I've plotted points for every month in the 20th and 21st centuries.
click to enlarge

In this chart we're relating present valuations to future returns. We're checking to see if buying the stock market when it's cheap translates into profits down the road.
Over a three year window, the data tell a fairly convincing story. Valutions matter a lot less than we're comfortable admitting. As indicated by our regression line, there is a modest correlation between present valuation and future return, but with an R-squared of 0.03, it should be ignored. So there you go.
Over a 3-year window, there is no correlation between ttm P/E's and the degree of future profitability.
Below average P/E's do not imply above average returns over a 3 year window, nor do above average P/E's imply below average returns. Some of you are probably excited to learn that, while others are thinking I've fipped my lid. But it's not me that's saying this. It's the data.
3 years isn't a very big window, and while it may not be too far off the average holding period of a long-term investment, it's not what most people have in mind when they think about investing for the "long run."
Let's broaden our window to 5 years. Same methodology. Current valuations versus 5-year subsequent returns.

Huh. Very similar story.
No correlation between present valuation and the degree future profitability. Our R-squared even went down a little bit. Not that a reading of 0.0295 matters in a statistical sense.
Just looking at the chart visually, you can see that when the earnings multiple gets really cheap, it suggests that your odds of getting burned really bad go down and your odds of coming out OK 5 years hence are a little better. That's assuming you can hang on for 5 years.
But in the middle of the curve, between a 10x and 20x multiple, it's a crapshoot. Even over 5 years. Here, let me provide some visual aid and get rid of all the extreme points.

Sure, there are more windows of gains than losses, but that's just because over the last century the market has tended to rise, not fall.
How confident are you -- really -- that any ttm P/E ratio between 10x and 20x tells you anything about what's to come over the next five years?
Let's broaden our window a little further. Let's widen our scope to 10 years. Does buying stocks when they are particularly cheap translate into more profitability for the coming decade?

The visual correlation is a little more clear. Our R-squared is a bit higher but is it even at the level where it's statistically meaningful? I'm still not sure I'm prepared to say that buying at lower multiples translates to higher profitability.
I feel good about saying one thing, though. There are few guarantees in this business, but -- surprise! -- if youy buy stocks when they are craaazy cheap and can hold onto them for 10 years, the odds suggest you'll make money.
For the record, those data points in the lower left quadrant, those that produced negative subsequent 10-year returns and started from very low valuations all began in mid-1920s. A decade later in the middle of the Great Depression, you had technically broken even on your purchase. But if you did happen to buy, say, in 1924, surely you must have taken something off the table at some point before the crash? At the peak your investment had quadrupled.
In practice, the answer to that question was probably "not bloody likely!" Given what we know about human psychology and patterns of behavior, you were probably loading your boat with even more stock in early 1929. Nevermind that by that point, the ttm price/earnings multiple had risen from just under 10 to over 17. That was almost two standard deviations above the average P/E multiple for the previous three decades. At that point, you should have been swapping out your stock for as much "imported" Canadian Whisky as your boat could fit.
Anyway, the point is that this analysis cuts both ways. If you buy when stocks are cheap relative to their ttm earnings, it's not quite a guarantee that you'll make money over the coming decade. Though the odds are definitely in your favor. The catch is that you shouldn't necessarily wait 10 years (or 5, or 3). You should remain mindful of that P/E multiple and reduce exposure accordingly as the ratio rises.
I know that this is pretty obvious to any disciple of Graham & Dodd or even a casual practitioner of fundamental analysis. But it's worth re-iterating because so few investors actually seem to do this. Human psychology is broken when it comes to investing, and when dealing with long windows of time, all sorts of noise comes into play. Still, the enduring concept is known to pretty much everyone. So let me wrap this section up with a few points that are substantially less obvious.
Three less-obvious conclusions
1. Correlation between earnings multiples and subsequent returns is loose. Statistically speaking, it's almost non-existent.
2. Unless you're dealing with long holding periods, pretty much any outcome is in play. Markets that are historically cheap can get a lot cheaper and take a lot longer than most humans are comfortable waiting before swinging back into profitability.
3. In truth, this kind of analysis is only really useful during a few select moments in history. It's only helpful at identifying extremes when the probabilities start to skew in the rational investor's favor. The problem is that during those extremes is when the fewest number of investors are bothering with this type of analysis. They're lost in all the other noise of the moment. They're buying tech stocks in 2001 because, it's the future, maaan! Or they're cowering in their bunker in 1948. Or broke in 1933. Or high on the Nifty Fifty in 1965, among other interesting things.
You don't need to look at an earnings multiple to know that if you buy some stocks and hold them long enough there will be periods where you will be in the red and also in the black.
Finally, let me add a twist to this story. There are other ways of assessing earnings. Some people like to normalize them. Personally, I like to look at the average earnings over the last decade. This is what Robert Shiller does. John Hussman relates prices to peak earnings. That's cool too.
Here's a chart relating normalized earnings (10 year average) to the return over the coming decade.

Now we're talking.
Over the course of a decade, low normalized PEs not only imply a greater chance of future profitability, they also suggest a greater degree of profitability.
Again, that's not me saying that. It's the data. If you buy the market when stocks are fundamentally cheap on a normalized basis and hold them for a long time, the odds are pretty good you'll make money, and make more of it than if you'd bought when stocks were expensive.
That chart carries one important footnote. You'll notice that in that chart there are two distinct curves. The top curve is pretty much everything from the 1990's through today. The lower curve represents the rest of history. You're welcome to completely disregard either curve, but the take home point is the same. There's a definite correlation between normalized valuation and future price appreciation.
Where are we at today?
All this research has been fun. But this is Seeking Alpha and at some point we need to talk turkey.
As of right now, the S&P 500 is priced right around 15x the last twelve months' earnings. You know what this means. This means that any outcome is in play.
On a normalized basis, the S&P 500 is currently priced just under 21x. Depending on whether you think the coming decade will look like the 90's/00's or the rest of 20th century, two very different baskets of outcomes are in play.
Last week I did a big walkthrough of the major economic fundamentals. Let me spoil the conclusion: pretty much all the data right now suggests an outcome where anything could happen. One of the secrets about professional portfolio management is that it's environments like these that are particularly hostile for mainstream investors. It's environments where anything can happen and investors aren't getting appropriately compensated with risk-adjusted returns for entering the market.
If you buy stocks today with the intention of holding them for at least 3 years, you should be prepared to at some point have to deal with losses of 30-60%. You could also be up double in 3 years. Why not hit the track instead? Or better yet, come visit our casinos here in my home state of Nevada!
Sorry, I don't mean to be cynical or flippant. The real take home point is that if you are trying to figure out how to invest today, the valuation of the broad market doesn't really need to be a part of your analysis. You should be doing different kinds of research to get you through the next decade. You've got to construct clever strategies and you've got to know a few tricks and tactics.
Earlier in the year I did an example of that here at Seeking Alpha. We're doing other things right now with our hedge fund clients. I even wrote an entire book about how average investors can construct some snazzy long-term strategies that should tilt the odds in your favor over the next decade. Because, God knows, the market valuation isn't doing anything right now to boost your probability of success.
How to play it
If you think that all this talk of historical valuation is bunk & hooey and you've got your own reasons for getting long the market, go ahead and load up on the SPDRs (SPY) or Diamonds (DIA). Then again, if you believe that these valuations suggest trouble on the horizon, feel free to short those ETFs as well. Generally speaking, I prefer shorting ETFs to individual stocks to express macro views because it eliminates the idiosyncratic risk associated with specific companies (aka "Volkswagen Risk").
If I was forced to buy something, I'd rather have a portfolio of systemically important U.S. stocks with clean balance sheets, defensible business models, and a high likelihood that they'll grow at a rate greater than GDP over the next decade. All the usual names apply -- Johnson & Johnson (JNJ), Exxon (XOM), Intel, (INTC), Wal-Mart (WMT), Proctor & Gamble (PG), and the like. This is still an environment where investors will be better off with active strategies and picking specific stocks than with passive strategies and positioning oneself like an index. I don't see that environment changing for a while.
Someday we'll find ourselves at another extreme. I'm looking forward to it. If market valuations do get down a ways below 10, on both a trailing and normalized basis, it'll be time to load the boat. It'll be a once-in-a-career trade and there will be so much noise and fear that most people will miss it.
An ability to look at this stuff rationally will ensure that you won't.
It's almost axiomatic in this business that investors should buy stocks when they're cheap and avoid them when they're expensive. All of us accept this principle without question, even if we're hardcore technical analysts.
But let me run you through a few charts that may raise some questions about your blind faith in the Price-to-Earnings multiple, the most popular way of measuring value.
What this first chart does is take a snapshot of the market's P/E ratio on January 1, 1900. Then it fast-forwards three years to see how much money you made or lost if you made an investment in the Dow. Those two pieces of data become one little dot on our scatter point chart. I've plotted points for every month in the 20th and 21st centuries.
click to enlarge
In this chart we're relating present valuations to future returns. We're checking to see if buying the stock market when it's cheap translates into profits down the road.
Over a three year window, the data tell a fairly convincing story. Valutions matter a lot less than we're comfortable admitting. As indicated by our regression line, there is a modest correlation between present valuation and future return, but with an R-squared of 0.03, it should be ignored. So there you go.
Over a 3-year window, there is no correlation between ttm P/E's and the degree of future profitability.
Below average P/E's do not imply above average returns over a 3 year window, nor do above average P/E's imply below average returns. Some of you are probably excited to learn that, while others are thinking I've fipped my lid. But it's not me that's saying this. It's the data.
3 years isn't a very big window, and while it may not be too far off the average holding period of a long-term investment, it's not what most people have in mind when they think about investing for the "long run."
Let's broaden our window to 5 years. Same methodology. Current valuations versus 5-year subsequent returns.
Huh. Very similar story.
No correlation between present valuation and the degree future profitability. Our R-squared even went down a little bit. Not that a reading of 0.0295 matters in a statistical sense.
Just looking at the chart visually, you can see that when the earnings multiple gets really cheap, it suggests that your odds of getting burned really bad go down and your odds of coming out OK 5 years hence are a little better. That's assuming you can hang on for 5 years.
But in the middle of the curve, between a 10x and 20x multiple, it's a crapshoot. Even over 5 years. Here, let me provide some visual aid and get rid of all the extreme points.
Sure, there are more windows of gains than losses, but that's just because over the last century the market has tended to rise, not fall.
How confident are you -- really -- that any ttm P/E ratio between 10x and 20x tells you anything about what's to come over the next five years?
Let's broaden our window a little further. Let's widen our scope to 10 years. Does buying stocks when they are particularly cheap translate into more profitability for the coming decade?
The visual correlation is a little more clear. Our R-squared is a bit higher but is it even at the level where it's statistically meaningful? I'm still not sure I'm prepared to say that buying at lower multiples translates to higher profitability.
I feel good about saying one thing, though. There are few guarantees in this business, but -- surprise! -- if youy buy stocks when they are craaazy cheap and can hold onto them for 10 years, the odds suggest you'll make money.
For the record, those data points in the lower left quadrant, those that produced negative subsequent 10-year returns and started from very low valuations all began in mid-1920s. A decade later in the middle of the Great Depression, you had technically broken even on your purchase. But if you did happen to buy, say, in 1924, surely you must have taken something off the table at some point before the crash? At the peak your investment had quadrupled.
In practice, the answer to that question was probably "not bloody likely!" Given what we know about human psychology and patterns of behavior, you were probably loading your boat with even more stock in early 1929. Nevermind that by that point, the ttm price/earnings multiple had risen from just under 10 to over 17. That was almost two standard deviations above the average P/E multiple for the previous three decades. At that point, you should have been swapping out your stock for as much "imported" Canadian Whisky as your boat could fit.
Anyway, the point is that this analysis cuts both ways. If you buy when stocks are cheap relative to their ttm earnings, it's not quite a guarantee that you'll make money over the coming decade. Though the odds are definitely in your favor. The catch is that you shouldn't necessarily wait 10 years (or 5, or 3). You should remain mindful of that P/E multiple and reduce exposure accordingly as the ratio rises.
I know that this is pretty obvious to any disciple of Graham & Dodd or even a casual practitioner of fundamental analysis. But it's worth re-iterating because so few investors actually seem to do this. Human psychology is broken when it comes to investing, and when dealing with long windows of time, all sorts of noise comes into play. Still, the enduring concept is known to pretty much everyone. So let me wrap this section up with a few points that are substantially less obvious.
Three less-obvious conclusions
1. Correlation between earnings multiples and subsequent returns is loose. Statistically speaking, it's almost non-existent.
2. Unless you're dealing with long holding periods, pretty much any outcome is in play. Markets that are historically cheap can get a lot cheaper and take a lot longer than most humans are comfortable waiting before swinging back into profitability.
3. In truth, this kind of analysis is only really useful during a few select moments in history. It's only helpful at identifying extremes when the probabilities start to skew in the rational investor's favor. The problem is that during those extremes is when the fewest number of investors are bothering with this type of analysis. They're lost in all the other noise of the moment. They're buying tech stocks in 2001 because, it's the future, maaan! Or they're cowering in their bunker in 1948. Or broke in 1933. Or high on the Nifty Fifty in 1965, among other interesting things.
You don't need to look at an earnings multiple to know that if you buy some stocks and hold them long enough there will be periods where you will be in the red and also in the black.
Finally, let me add a twist to this story. There are other ways of assessing earnings. Some people like to normalize them. Personally, I like to look at the average earnings over the last decade. This is what Robert Shiller does. John Hussman relates prices to peak earnings. That's cool too.
Here's a chart relating normalized earnings (10 year average) to the return over the coming decade.
Now we're talking.
Over the course of a decade, low normalized PEs not only imply a greater chance of future profitability, they also suggest a greater degree of profitability.
Again, that's not me saying that. It's the data. If you buy the market when stocks are fundamentally cheap on a normalized basis and hold them for a long time, the odds are pretty good you'll make money, and make more of it than if you'd bought when stocks were expensive.
That chart carries one important footnote. You'll notice that in that chart there are two distinct curves. The top curve is pretty much everything from the 1990's through today. The lower curve represents the rest of history. You're welcome to completely disregard either curve, but the take home point is the same. There's a definite correlation between normalized valuation and future price appreciation.
Where are we at today?
All this research has been fun. But this is Seeking Alpha and at some point we need to talk turkey.
As of right now, the S&P 500 is priced right around 15x the last twelve months' earnings. You know what this means. This means that any outcome is in play.
On a normalized basis, the S&P 500 is currently priced just under 21x. Depending on whether you think the coming decade will look like the 90's/00's or the rest of 20th century, two very different baskets of outcomes are in play.
Last week I did a big walkthrough of the major economic fundamentals. Let me spoil the conclusion: pretty much all the data right now suggests an outcome where anything could happen. One of the secrets about professional portfolio management is that it's environments like these that are particularly hostile for mainstream investors. It's environments where anything can happen and investors aren't getting appropriately compensated with risk-adjusted returns for entering the market.
If you buy stocks today with the intention of holding them for at least 3 years, you should be prepared to at some point have to deal with losses of 30-60%. You could also be up double in 3 years. Why not hit the track instead? Or better yet, come visit our casinos here in my home state of Nevada!
Sorry, I don't mean to be cynical or flippant. The real take home point is that if you are trying to figure out how to invest today, the valuation of the broad market doesn't really need to be a part of your analysis. You should be doing different kinds of research to get you through the next decade. You've got to construct clever strategies and you've got to know a few tricks and tactics.
Earlier in the year I did an example of that here at Seeking Alpha. We're doing other things right now with our hedge fund clients. I even wrote an entire book about how average investors can construct some snazzy long-term strategies that should tilt the odds in your favor over the next decade. Because, God knows, the market valuation isn't doing anything right now to boost your probability of success.
How to play it
If you think that all this talk of historical valuation is bunk & hooey and you've got your own reasons for getting long the market, go ahead and load up on the SPDRs (SPY) or Diamonds (DIA). Then again, if you believe that these valuations suggest trouble on the horizon, feel free to short those ETFs as well. Generally speaking, I prefer shorting ETFs to individual stocks to express macro views because it eliminates the idiosyncratic risk associated with specific companies (aka "Volkswagen Risk").
If I was forced to buy something, I'd rather have a portfolio of systemically important U.S. stocks with clean balance sheets, defensible business models, and a high likelihood that they'll grow at a rate greater than GDP over the next decade. All the usual names apply -- Johnson & Johnson (JNJ), Exxon (XOM), Intel, (INTC), Wal-Mart (WMT), Proctor & Gamble (PG), and the like. This is still an environment where investors will be better off with active strategies and picking specific stocks than with passive strategies and positioning oneself like an index. I don't see that environment changing for a while.
Someday we'll find ourselves at another extreme. I'm looking forward to it. If market valuations do get down a ways below 10, on both a trailing and normalized basis, it'll be time to load the boat. It'll be a once-in-a-career trade and there will be so much noise and fear that most people will miss it.
An ability to look at this stuff rationally will ensure that you won't.
Subscribe to:
Posts (Atom)