Inflation Expectations: A Primer
by: The Baseline Scenario April 09, 2009
By James Kwak
Only a few years ago, the accepted remedy for a recession was for the Federal Reserve to lower interest rates - namely, the Federal funds rate. Now, however, the economy has been stuck in recession for over fifteen months and the Federal funds rate has spent the last several months at zero. (The Fed funds rate cannot ordinarily be negative, because one bank won’t lend $100 to another bank and accept less than $100 in return; it always has the option of just holding onto its $100.) As a result, the Fed has resorted to other policy tools, most notably large-scale purchases of agency and Treasury securities, funded by creating money. (Here’s James Hamilton’s analysis.)
As the Fed’s monetary policy plays a more prominent role in the response to the economic crisis, there will be more talk of inflation or, more accurately, inflation expectations. While inflation is what affects the purchasing power of the money in your wallet, inflation expectations are what affect people’s behavior in ways that have a long-term economic impact. Take the case of wage negotiations, for example: a union that believes inflation will average 5% over the life of a contract will demand higher wage increases than a union that believes inflation will average only 1%. Once those higher wages are built into the contract, the employer is forced to raise prices in order to cover those wage increases, and inflation begins to ripple through the economy.
One of the major objectives of modern monetary policy is to control inflation expectations, because controlling inflation expectations is the first step to controlling inflation. If there is a short-term burst of inflation - as we had a year ago, if you look at headline inflation numbers that include the prices of food and energy - the macroeconomic consequences can be limited if people believe that the Fed can and will bring inflation under control.
Unfortunately, it is impossible to know exactly what people’s inflation expectations are; in fact, it may not even be a sensible question, since different people have different understandings of what inflation is. However, there are three main approaches to estimating inflation expectations.
1. Inflation-indexed government bonds. (If you need a refresher on how a bond works, read the first part of this article.) A traditional bond is a stream of payments that is fixed in nominal terms: for example, $100 in 10 years, and 6% interest, paid semi-annually ($3 every 6 months). Such a bond is not inflation-indexed; if inflation goes up, the purchasing power of that $100 goes down, and it’s too bad for the bondholder.
An inflation-indexed bond, by contrast, pays an amount that is indexed to some measure of inflation. In the U.S., where these bonds are called Treasury Inflation Protected Securities (TIPS), we use the Consumer Price Index. A TIPS bond may have a $100 face value and pay a 2% interest rate. However, every 6 months, that $100 face value is adjusted to reflect the change in the CPI, and the interest payment is calculated as a percentage of the adjusted value of the bond. Then, after 10 years, the bondholder gets back not $100, but $100 times the ratio between the CPI at the end of the period and the CPI at the beginning of the period. This way the bondholder is guaranteed a 2% real return (assuming he paid $100 for the bond), no matter what the rate of inflation is in the interim.
The implied inflation expectation, then, is the difference between the yield on an ordinary bond and the yield on an inflation-indexed bond with the same maturity. If the 5-year Treasury has a yield of 4% and the 5-year TIPS has a yield of 2%, then inflation expectations for the next five years are (about) 2% per year. The reasoning is that in order to buy the regular bond as opposed to the inflation-indexed bond, an investor has to be paid a higher yield to compensate him for the level of inflation that he expects.
Actually, in addition to expected inflation, the Treasury investor also has to be paid an inflation risk premium because, all things being equal, it is better not to have inflation risk than to have it. So the implied inflation expectation is actually slightly less than the spread between the regular and the inflation-indexed bonds. If you didn’t follow that, don’t worry, just remember that, roughly speaking, Treasury yield = TIPS yield + expected inflation.
2. Inflation swaps. These are a type of derivative contract, where the payments under the contract depend on the value of an inflation index, such as the CPI. The swap has a nominal value of, say, $100, but $100 never changes hands. Instead, at the end of some period of time, party A pays party B a fixed rate of interest on $100 - say 2.5% per year. At the end of the period, B pays A the cumulative percentage change in the inflation index over the period. Assuming A has $100 in his pocket, he has now hedged the inflation risk on that $100, because no matter what happens, at the end of the period he will get an amount that compensates him for the impact of inflation on his $100. The price of this hedge is $2.50 per year. (Because these are over-the-counter contracts, there are many variations on this, including swaps with periodic coupon payments.)
For the same reasons described above, the implied inflation expectation is roughly 2.5% per year: party B thinks inflation will be less than 2.5% per year, and therefore is willing to take 2.5% and pay the amount of inflation; party A thinks inflation will be more than 2.5% per year, and therefore is willing to pay 2.5% per year to get the amount of inflation back. So the market clears at 2.5%. (Actually, for the exact same reasons as with bonds - party B has to be paid an inflation risk premium for absorbing the risk in this trade - the inflation expectation is slightly less than 2.5% per year. There are also some complications having to do with the lag in the publication of inflation indices, but let’s ignore that for now.)
One curiosity is that the inflation-indexed bond method and the inflation swap method can produce different estimates. Theoretically this should not happen, because if two products that will have the same price in the long term (since they are based on the same index) have different prices today, there should be an arbitrage opportunity. Why this happens in practice is discussed on pp. 5-6 of this Bank of England paper. (Thanks to Bond Girl for pointing out the paper.)
3. Surveys. You can also just ask people what they think inflation will be. Economists ordinarily prefer markets, under the principle that when people are paying money they are signaling what they really believe. But if you think there are sufficient problems with the markets you may want to go with surveys. Tim Duy has a post with a number of charts, including one of an inflation expectations survey.
So what do things look like today?

This is the historical graph for implied U.S. inflation over the next 5 years, based on TIPS. Remember, you are looking at 5-year inflation expectations as they changed over the last year.
In the dark days of October-December, inflation expectations were clearly negative: that is, the market was expecting deflation over a 5-year period. Things have picked up, but inflation expectations are still around 0.6% - far less than the 1.7-2.0% targeted by the Fed. And that 0.6% is before adjusting for the inflation risk premium, so inflation expectations are actually lower than the chart shows.
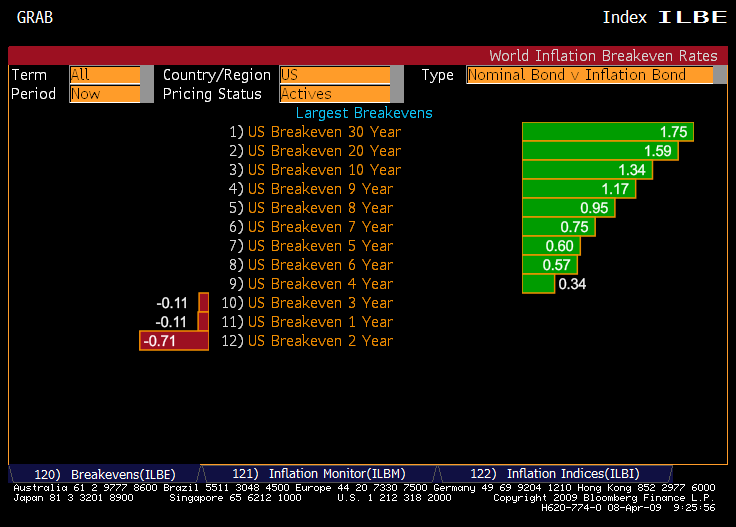
And these are current inflation expectations over various time horizons, again derived from inflation-indexed bonds. Note that they are sorted by value, not by time.
TIPS are not very liquid compared to regular Treasury bonds, and the implied inflation expectation numbers are sensitive to aberrations in both the Treasury and the TIPS markets (which have both been pretty aberrant recently). For example, if there is a shortage of TIPS of a given maturity, then the TIPS yields will be artificially low and the implied inflation expectation will be artificially high. Still, it seems like inflation expectations are on the low side, even when it comes to the 10- and 20-year time horizons. (I don’t know what’s going on with the 2-year number: when I look at the underlying bonds, it seems like it should be about -0.1%.)
For more on measuring inflation expectations, there is a short primer from the San Francisco Fed, as well as the Bank of England paper mentioned above.

