Near-Term Technical Picture Appears Bullish but Fundamentals Point to Downside Potential
| May 29, 2011
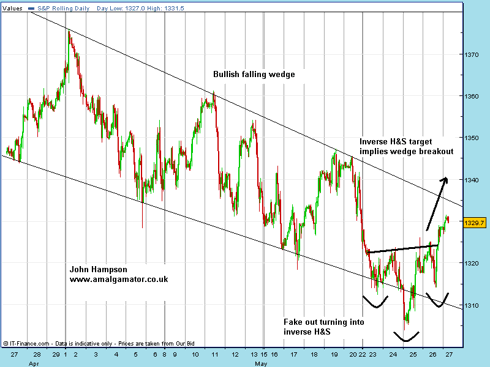
The near term technical picture for stocks appears bullish (click to enlarge images):
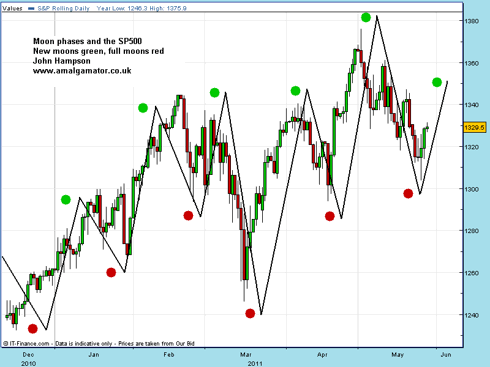
There is also upward pressure into and around the new moon of June 1st:
Plus there are three current contrarian bullish indicator readings: AAII sentiment, Advance / Declines and Investors Intelligence market correction expectations:
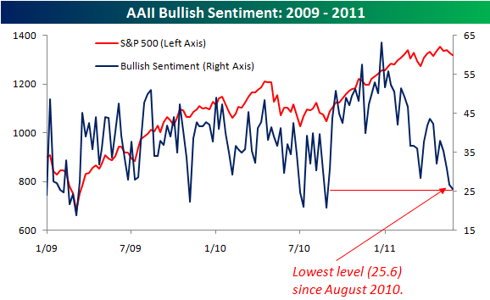
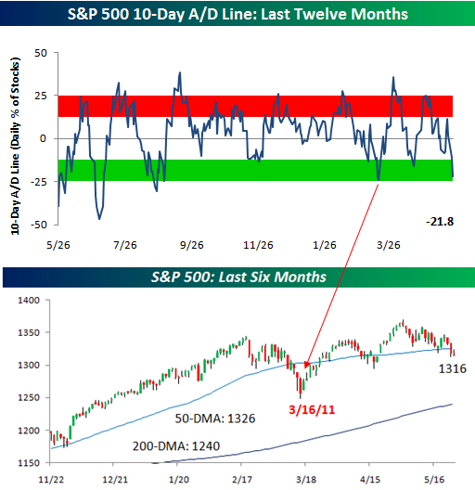
Source: Bespoke Investment
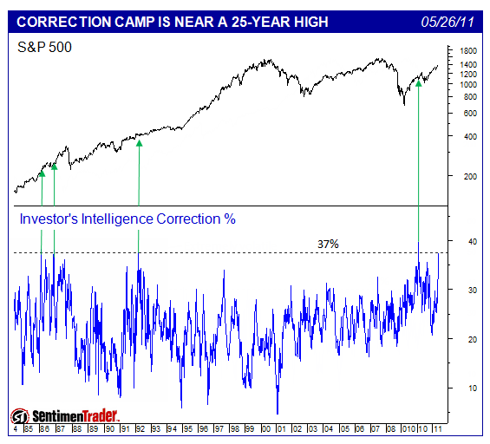
Source: Sentimentrader
A little caution is required though as there is a window of forecasted geomagnetism 27th to 30th May, which would result in negative pressure.
It is important to note that we haven't reached oversold readings or seen sellling capitulation signals that typically mark a new bullish upleg for the market, and I believe this fits with a continued period of market consolidation and range ahead.
Leading indicators have recently ticked lower but cannot yet be said to be pointing to a significant slowdown, though they may go on to do so. Coincident and retrospective economic data of late has surprised to the downside, suggesting that oil prices and Japan's troubles have had more of an impact than forecast. This is reflected in the Citgroup Economic Surprise Index:
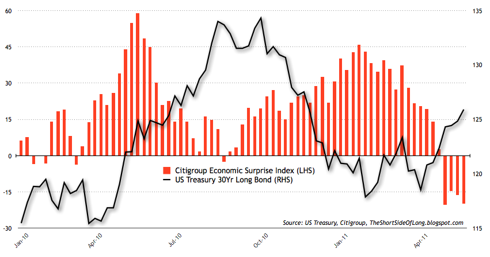
Source: Short Side Of Long
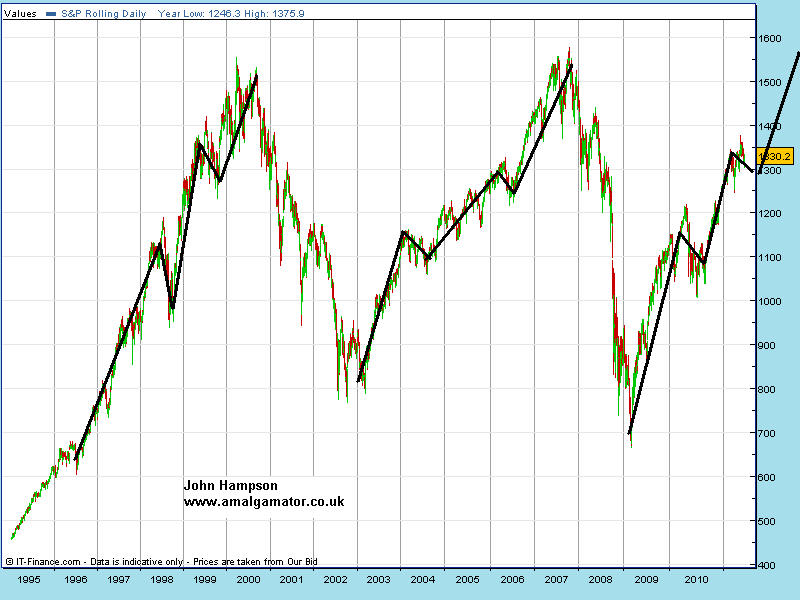
Given recent disappointment in both leading and coincident data, together with imminent removal of US QE, it should not be surprising that stocks have not been able to break higher. At the same time, it is noteworthy that there has been little momentum in selling and despite being only 50 points off the S&P500 high, certain indicators (such as the three above from Bespoke and Sentimentrader) have reset fully. I believe such a combination means it is most likely that we will see an extended period of consolidation ahead but without deep selling, and that would be relatively normal here:

A period of consolidation and range is often difficult to trade. My strategy is to look for short term opportunities on the long side. I choose 'buy the dips' over 'sell the rips' because of my reasoning that the cyclical bull market will continue (see May 12th analysis: 11 reasons why the cyclical stocks bull will continue).
However, I am aware that the Puetz crash window of June 9-18, the removal of QE at the end of June (if the Fed gives no signal of a QE3) and the potential continued decline in leading indicators all have the potential to accelerate a move to the downside, so I will be keeping leverage low.
I would welcome a wash-out move to the downside, as it will likely present the last golden opportunity to load up on the long side for the final part of this cyclical stocks bull. But patience may be required, as we work through the current economic soft patch, before the market is ready to truly push on again. Danske Bank expect the second half of the year to see a natural upturn in growth again, as Japan recovers and as oil prices have eased.
If that positive feedback looping doesn't materialise as the trigger for the final cyclical bull upleg, then it isn't unreasonable to expect some form of QE3 may be administered to do the job, as the Fed has been clear in its support of asset prices.
Disclosure: I am long stock indices

There is also upward pressure into and around the new moon of June 1st:

Plus there are three current contrarian bullish indicator readings: AAII sentiment, Advance / Declines and Investors Intelligence market correction expectations:


Source: Bespoke Investment
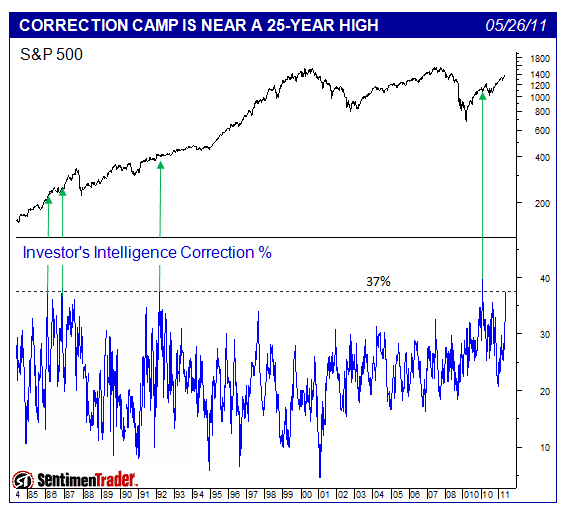
Source: Sentimentrader
A little caution is required though as there is a window of forecasted geomagnetism 27th to 30th May, which would result in negative pressure.
It is important to note that we haven't reached oversold readings or seen sellling capitulation signals that typically mark a new bullish upleg for the market, and I believe this fits with a continued period of market consolidation and range ahead.
Leading indicators have recently ticked lower but cannot yet be said to be pointing to a significant slowdown, though they may go on to do so. Coincident and retrospective economic data of late has surprised to the downside, suggesting that oil prices and Japan's troubles have had more of an impact than forecast. This is reflected in the Citgroup Economic Surprise Index:
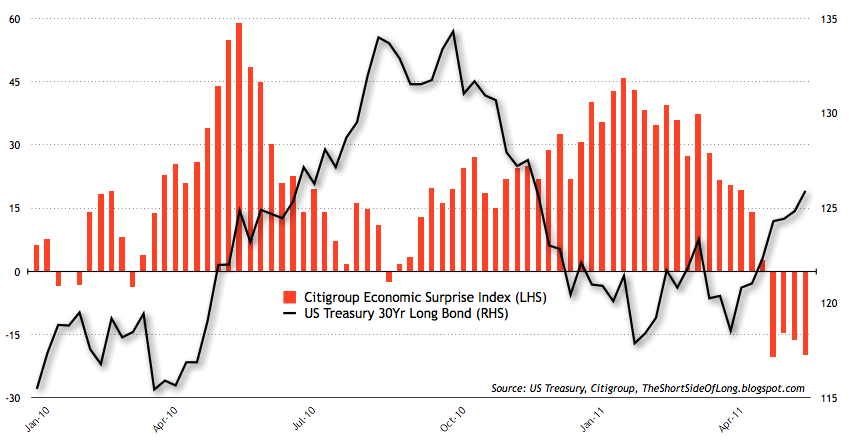
Source: Short Side Of Long
Given recent disappointment in both leading and coincident data, together with imminent removal of US QE, it should not be surprising that stocks have not been able to break higher. At the same time, it is noteworthy that there has been little momentum in selling and despite being only 50 points off the S&P500 high, certain indicators (such as the three above from Bespoke and Sentimentrader) have reset fully. I believe such a combination means it is most likely that we will see an extended period of consolidation ahead but without deep selling, and that would be relatively normal here:
A period of consolidation and range is often difficult to trade. My strategy is to look for short term opportunities on the long side. I choose 'buy the dips' over 'sell the rips' because of my reasoning that the cyclical bull market will continue (see May 12th analysis: 11 reasons why the cyclical stocks bull will continue).
However, I am aware that the Puetz crash window of June 9-18, the removal of QE at the end of June (if the Fed gives no signal of a QE3) and the potential continued decline in leading indicators all have the potential to accelerate a move to the downside, so I will be keeping leverage low.
I would welcome a wash-out move to the downside, as it will likely present the last golden opportunity to load up on the long side for the final part of this cyclical stocks bull. But patience may be required, as we work through the current economic soft patch, before the market is ready to truly push on again. Danske Bank expect the second half of the year to see a natural upturn in growth again, as Japan recovers and as oil prices have eased.
If that positive feedback looping doesn't materialise as the trigger for the final cyclical bull upleg, then it isn't unreasonable to expect some form of QE3 may be administered to do the job, as the Fed has been clear in its support of asset prices.
Disclosure: I am long stock indices