We have to be very careful to get out of more equities as stocks rebound because it could be the last chance before we trend another 15 - 20% lower.
Trending Lower Across The Board
Let’s talk about the dollar for a moment. The US dollar has been stuck in a very large trading range during the past 4 months. But when the dollar actually breaks out of this pattern in either direction, we should see some big price movements across the board in stocks and commodities.
From July through mid-August I was bearish on the dollar. But over the past 2 weeks the price action has become more neutral (more bullish), in my opinion. Its clear there is still indecision with the dollar's value, because every surge in price either up or down is quickly followed by a surge in the opposite direction. The key here is that the support level down at the 73.50 area has held more than three times, and now I think the downward momentum is about to shift. The PowerShares DB USD Bull ETF (UUP) is a good option.
Dollar Index Chart

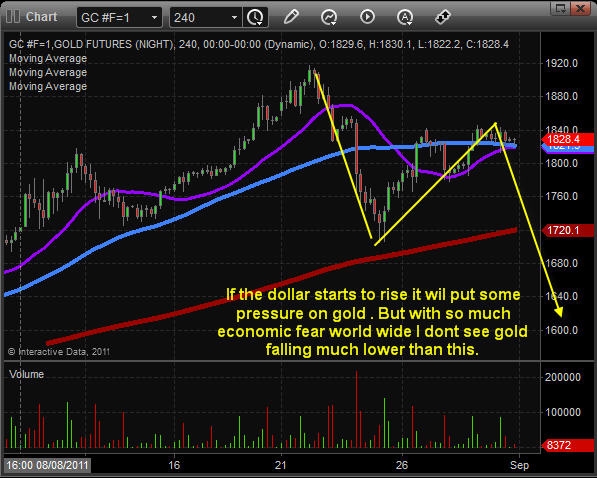
Gold Chart
Looking at the gold chart, I see potential for another sharp drop to the low $1,600s. While I like the look of this chart for lower prices, there is still a wild card, which is the eurozone issues. I’m not willing to bet on lower prices because we could wake up any day to some poor news that instantly sends gold higher. Rather, I am waiting for things to unfold, and then I will look to buy again for another 10%-20% gain on the next rally.

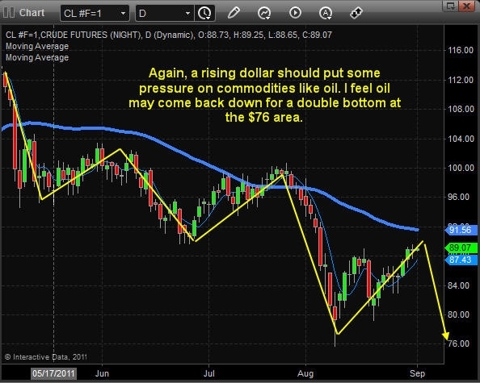
Crude Oil Chart
This chart is straightforward: The trend is down, and at this time all bounces are to be looked at as shorting opportunities.
SP500 Index
The equities market has broken down sharply over the past couple months. Now we are seeing a rebound, and small cap stocks are making big gains. With the dollar looking bullish and stocks trading up at resistance, I have a feeling we may see another downward move within the next week or so to test the lows or make a new low before putting in a real bottom.

Mid-Week Trend Trading Conclusion:
In short, I feel the market overall is leaning towards lower prices in the coming week or two. After that we will have to re-analyze, because it may be a fantastic buying opportunity for stocks and commodities.
From July through mid-August I was bearish on the dollar. But over the past 2 weeks the price action has become more neutral (more bullish), in my opinion. Its clear there is still indecision with the dollar's value, because every surge in price either up or down is quickly followed by a surge in the opposite direction. The key here is that the support level down at the 73.50 area has held more than three times, and now I think the downward momentum is about to shift. The PowerShares DB USD Bull ETF (UUP) is a good option.
Dollar Index Chart

Gold Chart
Looking at the gold chart, I see potential for another sharp drop to the low $1,600s. While I like the look of this chart for lower prices, there is still a wild card, which is the eurozone issues. I’m not willing to bet on lower prices because we could wake up any day to some poor news that instantly sends gold higher. Rather, I am waiting for things to unfold, and then I will look to buy again for another 10%-20% gain on the next rally.
Crude Oil Chart
This chart is straightforward: The trend is down, and at this time all bounces are to be looked at as shorting opportunities.

SP500 Index
The equities market has broken down sharply over the past couple months. Now we are seeing a rebound, and small cap stocks are making big gains. With the dollar looking bullish and stocks trading up at resistance, I have a feeling we may see another downward move within the next week or so to test the lows or make a new low before putting in a real bottom.

Mid-Week Trend Trading Conclusion:
In short, I feel the market overall is leaning towards lower prices in the coming week or two. After that we will have to re-analyze, because it may be a fantastic buying opportunity for stocks and commodities.
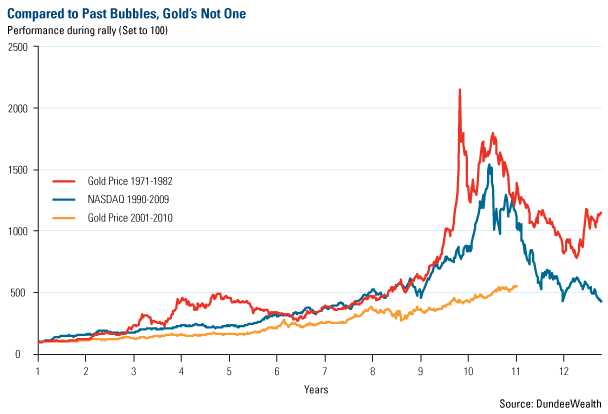
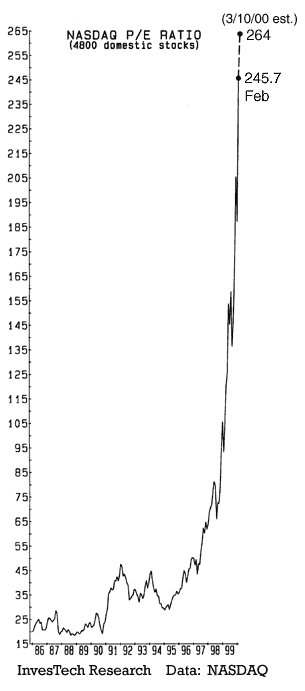 We do have a frame of reference for the internet bubble. You might remember that time as a period when everyone had a hot stock tip. Everyone was up hundreds of percent, or more, on companies like Cisco (