Sunday 27 July 2014

Investment Outlook for 2014 - 2015


This is one of the best written article on investments and I'm in total agreement with Shane Oliver. I often say that we are still in a sweet spot because interest rates are rock bottom in the west. But I expect greater volatility going forward. Upside for US, Europe and Japan equities will be < 15%.

Asia and EM equities will be sideways for a while this year before finally shooting forward.

Investment outlook after another solid financial year | Shane Oliver

In a recent economic commentary Dr Shane Oliver, Head of Investment Strategy and Chief Economist at AMP Capital says the past financial year saw another 12 months of strong returns.
Returns of around 20% from shares, solid returns from property assets and good returns from bonds saw balanced growth superannuation funds return around 13% on average.
This was the second year in a row of double digit gains. By contrast the return from cash was poor and average 12 month bank term deposits returned less than 4%.

Source: Thomson Reuters, AMP Capital
As always there has been plenty to fret about, including:
  • The mid 2013 “taper tantrum” in the US, with investors fearing the Fed’s decision to start winding down its quantitative easing program would threaten the US economy and shares;
  • The US Government shutdown and debt default worries in October and the March quarter economic contraction;
  • The slow recovery and deflation worries in Europe;
  • Fears of a sales tax hike driven recession in Japan;
  • Another bout of hard landing worries regarding China centred on the property and shadow banking sectors;
  • Worries about the impact on emerging countries of Fed tapering;
  • Geopolitical worries regarding Syria, Ukraine and Iraq;
  • Ongoing worries as to how Australia will fare as the mining boom fades and whether the May Budget will worsen the economic outlook; and
  • The last six months has seen intensifying concerns that share markets are set for a fall.
But these concerns were offset by a range of factors:
Free property strategy session
  • A continuing improvement in the global economy;
  • The Fed’s tapering has clearly been contingent on improving growth with a rate hike still a fair way off;
  • Further easing measures by the European Central Bank;
  • Little global economic damage from geopolitical risks;
  • Continuing record monetary stimulus in Japan;
  • A stabilisation in Chinese economic growth helped by various mini-stimulus measures;
  • No sign of capital flight from emerging countries and election optimism regarding India and Indonesia; and
  • Okay growth in Australia helped by low interest rates.
This has all seen growth assets boosted by a reasonable growth and profit outlook and bonds helped by continued easy monetary conditions. The latter has also seen an ongoing search for yield by investors.
With shares no longer dirt cheap it’s likely returns will slow – indeed they have over the last six months. However, the cyclical bull market in shares likely has further to go.
This along with reasonable returns from property assets should underpin further gains in diversified investment portfolios over the year ahead.

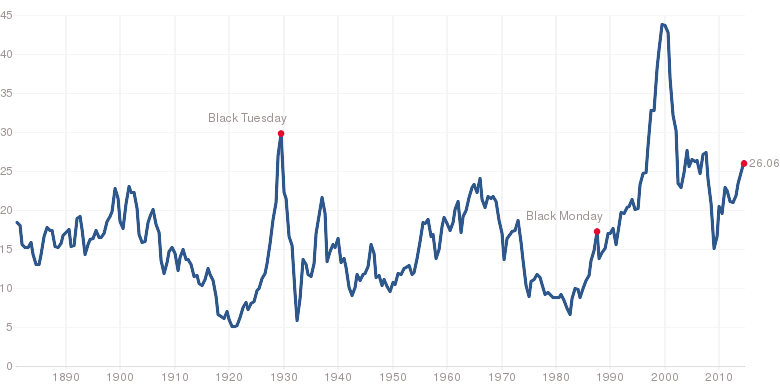
Equity valuations – ok

After strong gains through 2012 and 2013 shares are no longer dirt cheap. However, as can be seen in the next chart, valuation measures (which are based on a range of measures including a comparison of the yield on shares with that on bonds) show shares are not expensive.
Source: Bloomberg, AMP Capital
Cyclical bull markets in shares invariably see three phases. First an unwinding of cheap valuations helped by low interest rates. The second is driven by stronger profits.
And the third phase is a blow off as investor confidence becomes excessive pushing shares into expensive territory. Our assessment is that we are still in the second phase and as such the cyclical/profit backdrop remains critically important.

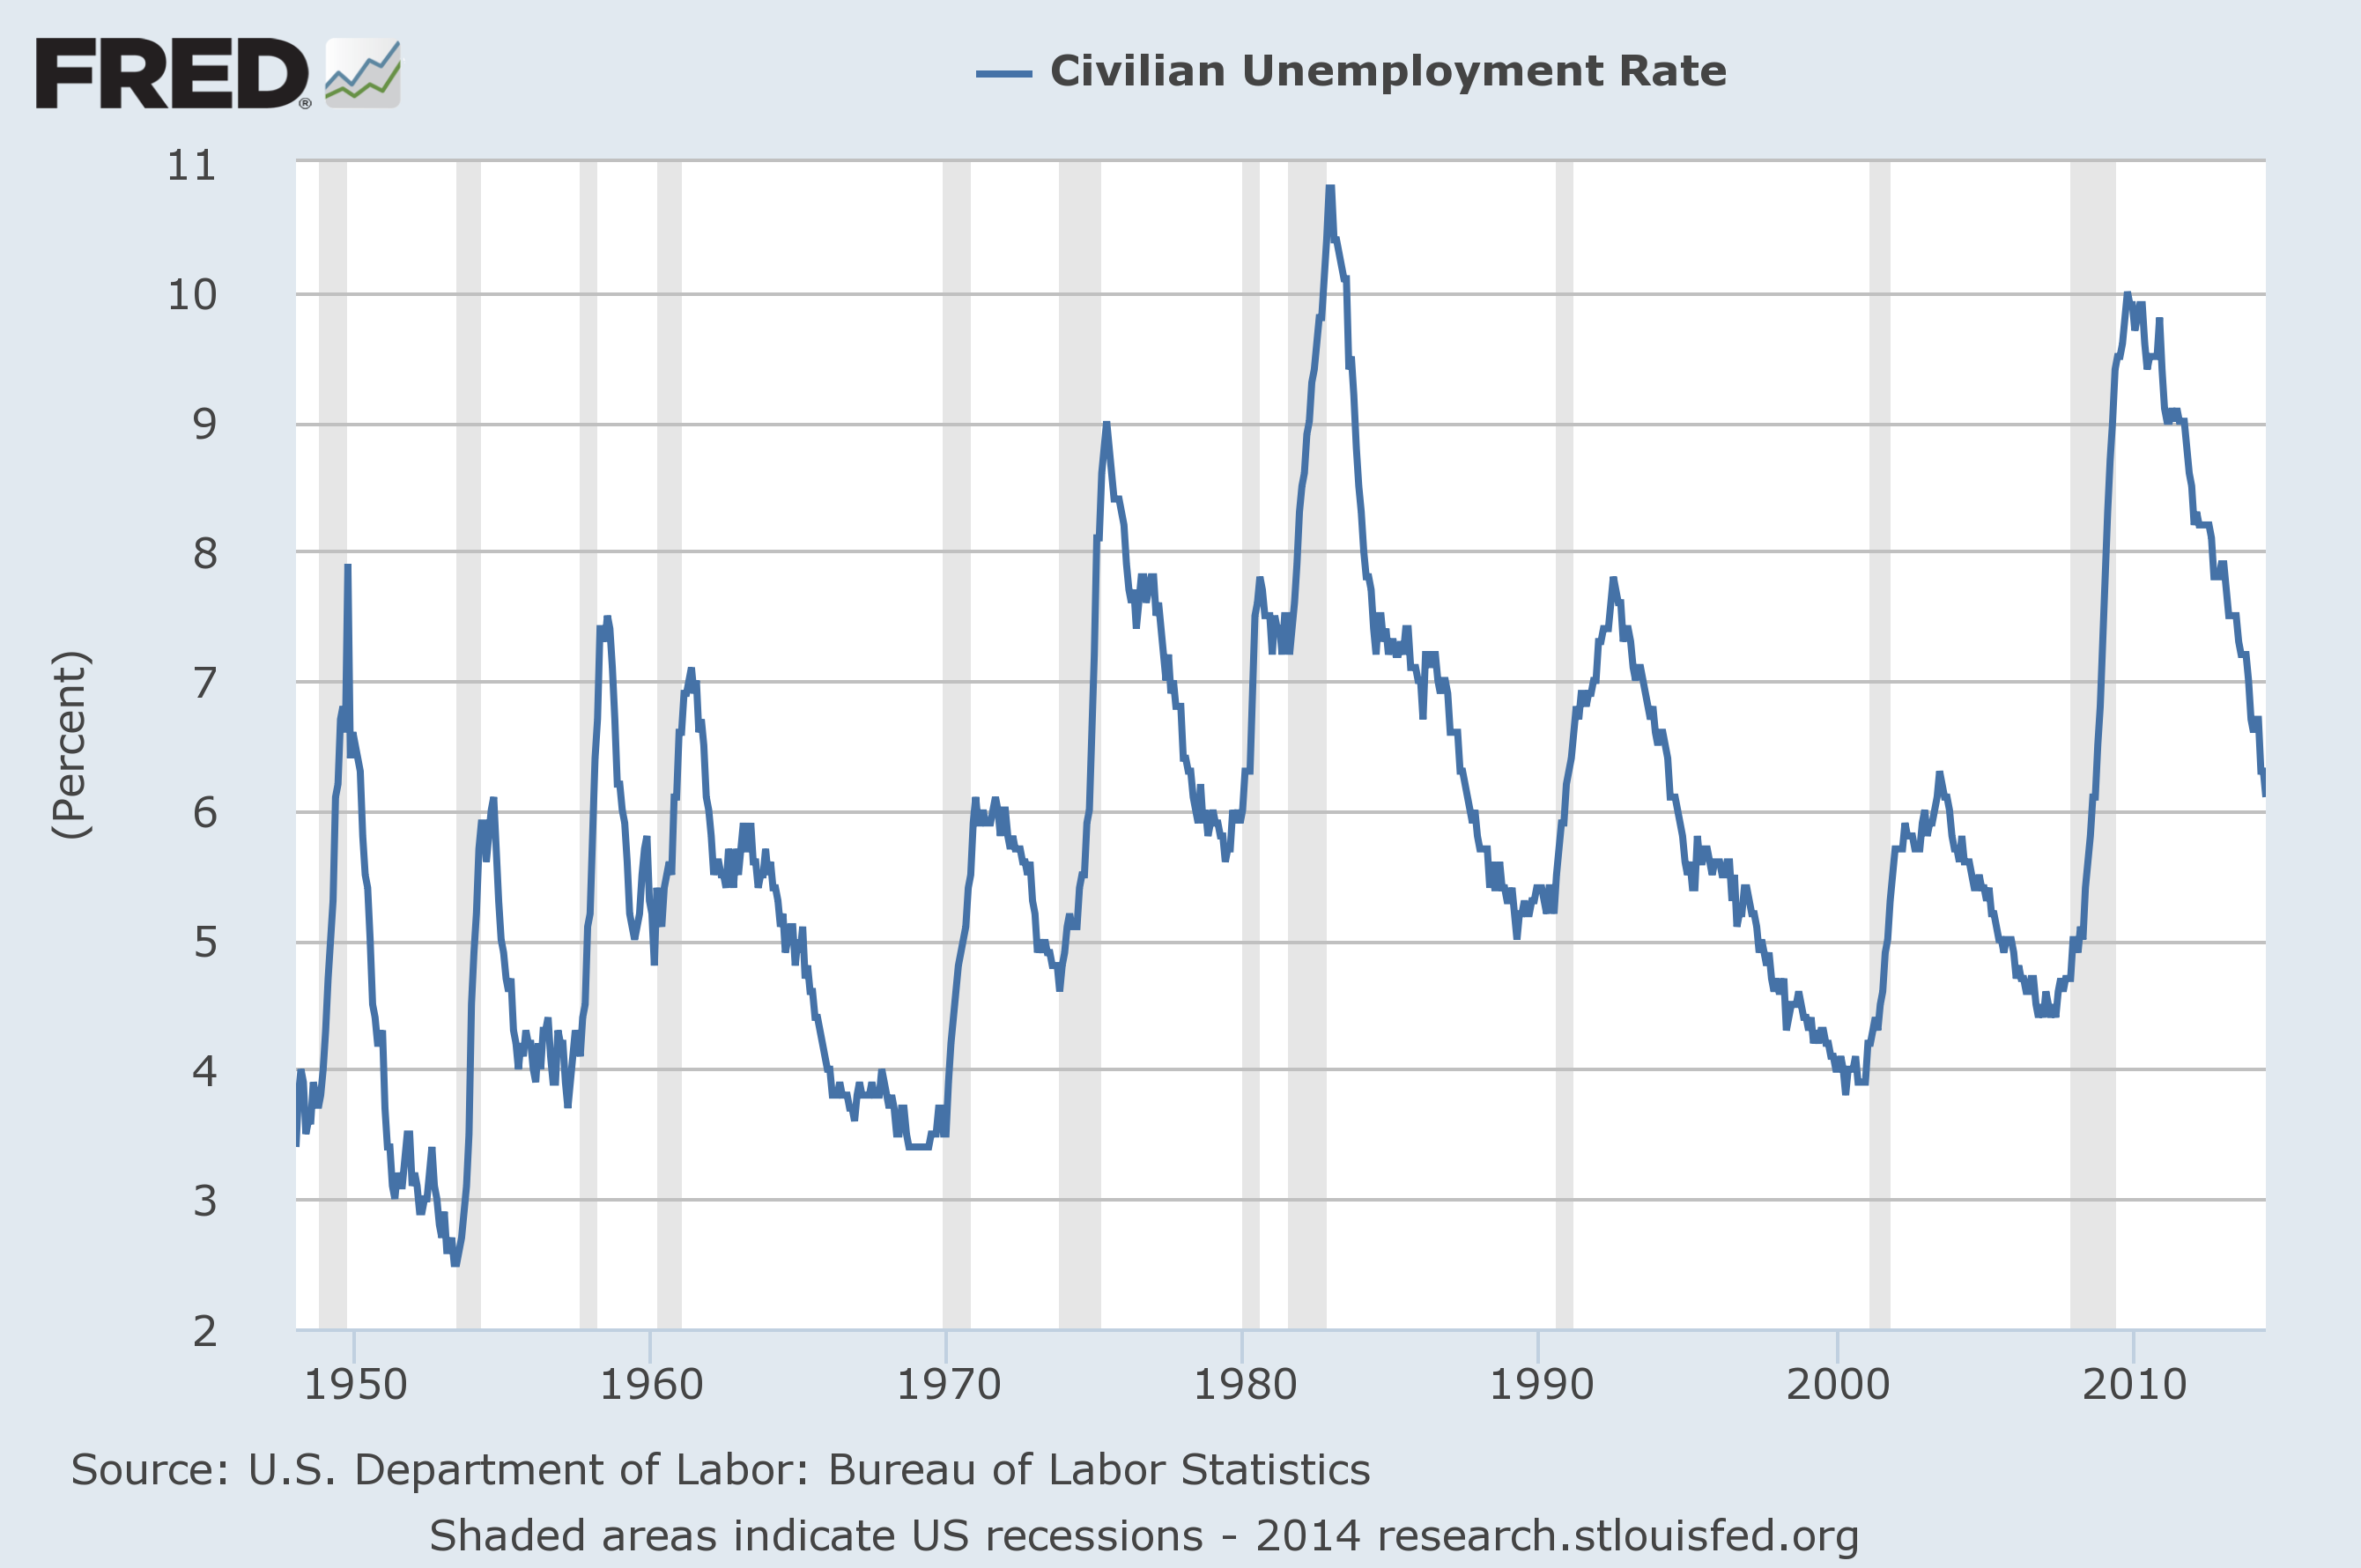
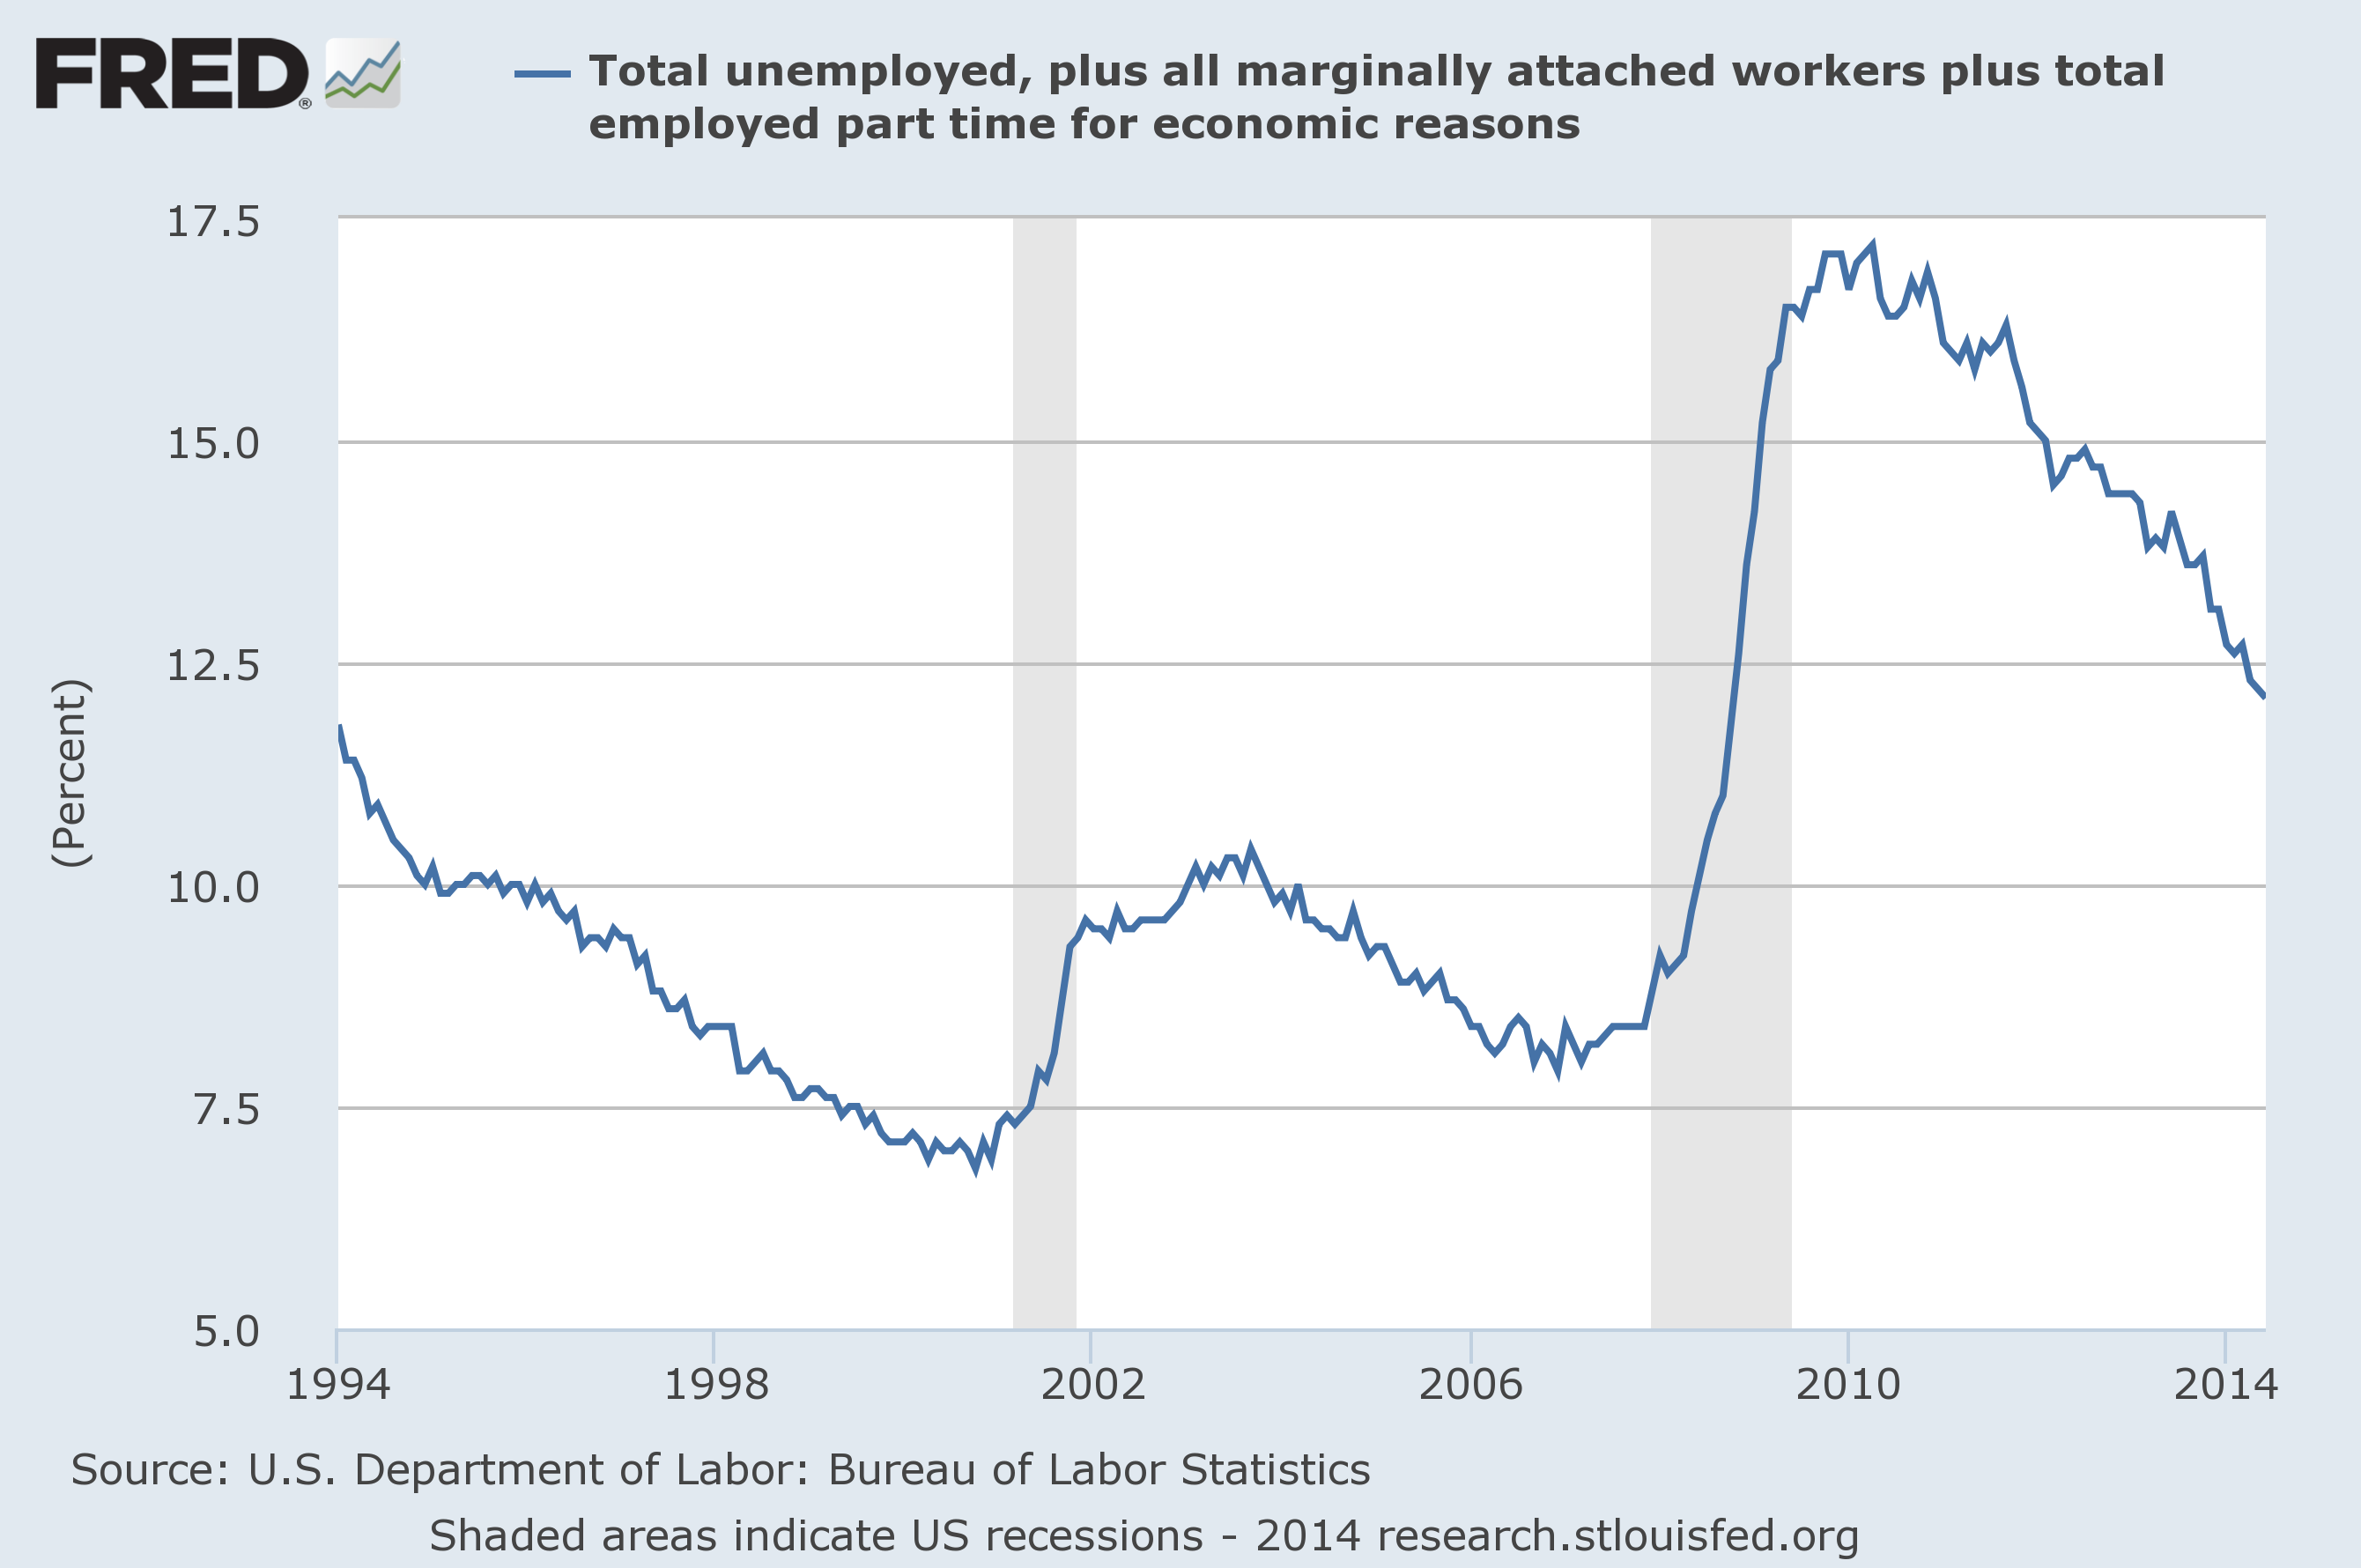
The economic cycle – slow improvement

We are still in the sweet spot of the global economic cycle. Growth is on the mend but only gradually such that spare capacity and excess savings remains immense so inflation remains tame, monetary conditions easy and bond yields low.
In fact the March quarter growth soft patch seen in the US, Europe and China was more positive than negative because it wasn’t threatening but further pushed out the timing of any monetary tightening.
By region:
  • After a contraction in the March quarter driven by mostly temporary factors, the US economy is continuing to improve and looks on track for circa 3% growth. The jobs market and business investment are improving and shale oil boom is providing a long term boost both directly and indirectly via cheap electricity costs for business.
  • Growth has returned to Europe. Ireland and Portugal have emerged from their bailout programs and structural reform seems to be on track. But growth is far from robust, inflation is too low and uncertainty around the banks is likely to linger till later this year after the completion of the ECB’s bank asset quality review. All of which means continuing recovery but ongoing need for ECB support.
  • Japan appears to be weathering its sales tax hike well, with ultra easy money and economic reforms providing confidence growth will continue.
  • Chinese growth looks to be on track for around 7.5% helped by various mini-stimulus measures.
  • Emerging world growth generally isn’t as strong as it used to be but it looks to be stabilising around 5%.
Reflecting this, the global manufacturing conditions PMI is at levels consistent with good, but not booming global growth.
Source: Bloomberg, AMP Capital
This suggests global growth is likely to pick up a notch which should underpin a modest improvement in profit growth.
In Australia, while the mining investment slowdown, the impact on confidence from the May Budget and the too high $A pose a short term threat, underlying growth is likely to have picked up to a 3% pace by year end and continue through next year helped by a housing construction boom, a Senate induced softening in some of the harsher aspects of the Budget and strength in resource export volumes.

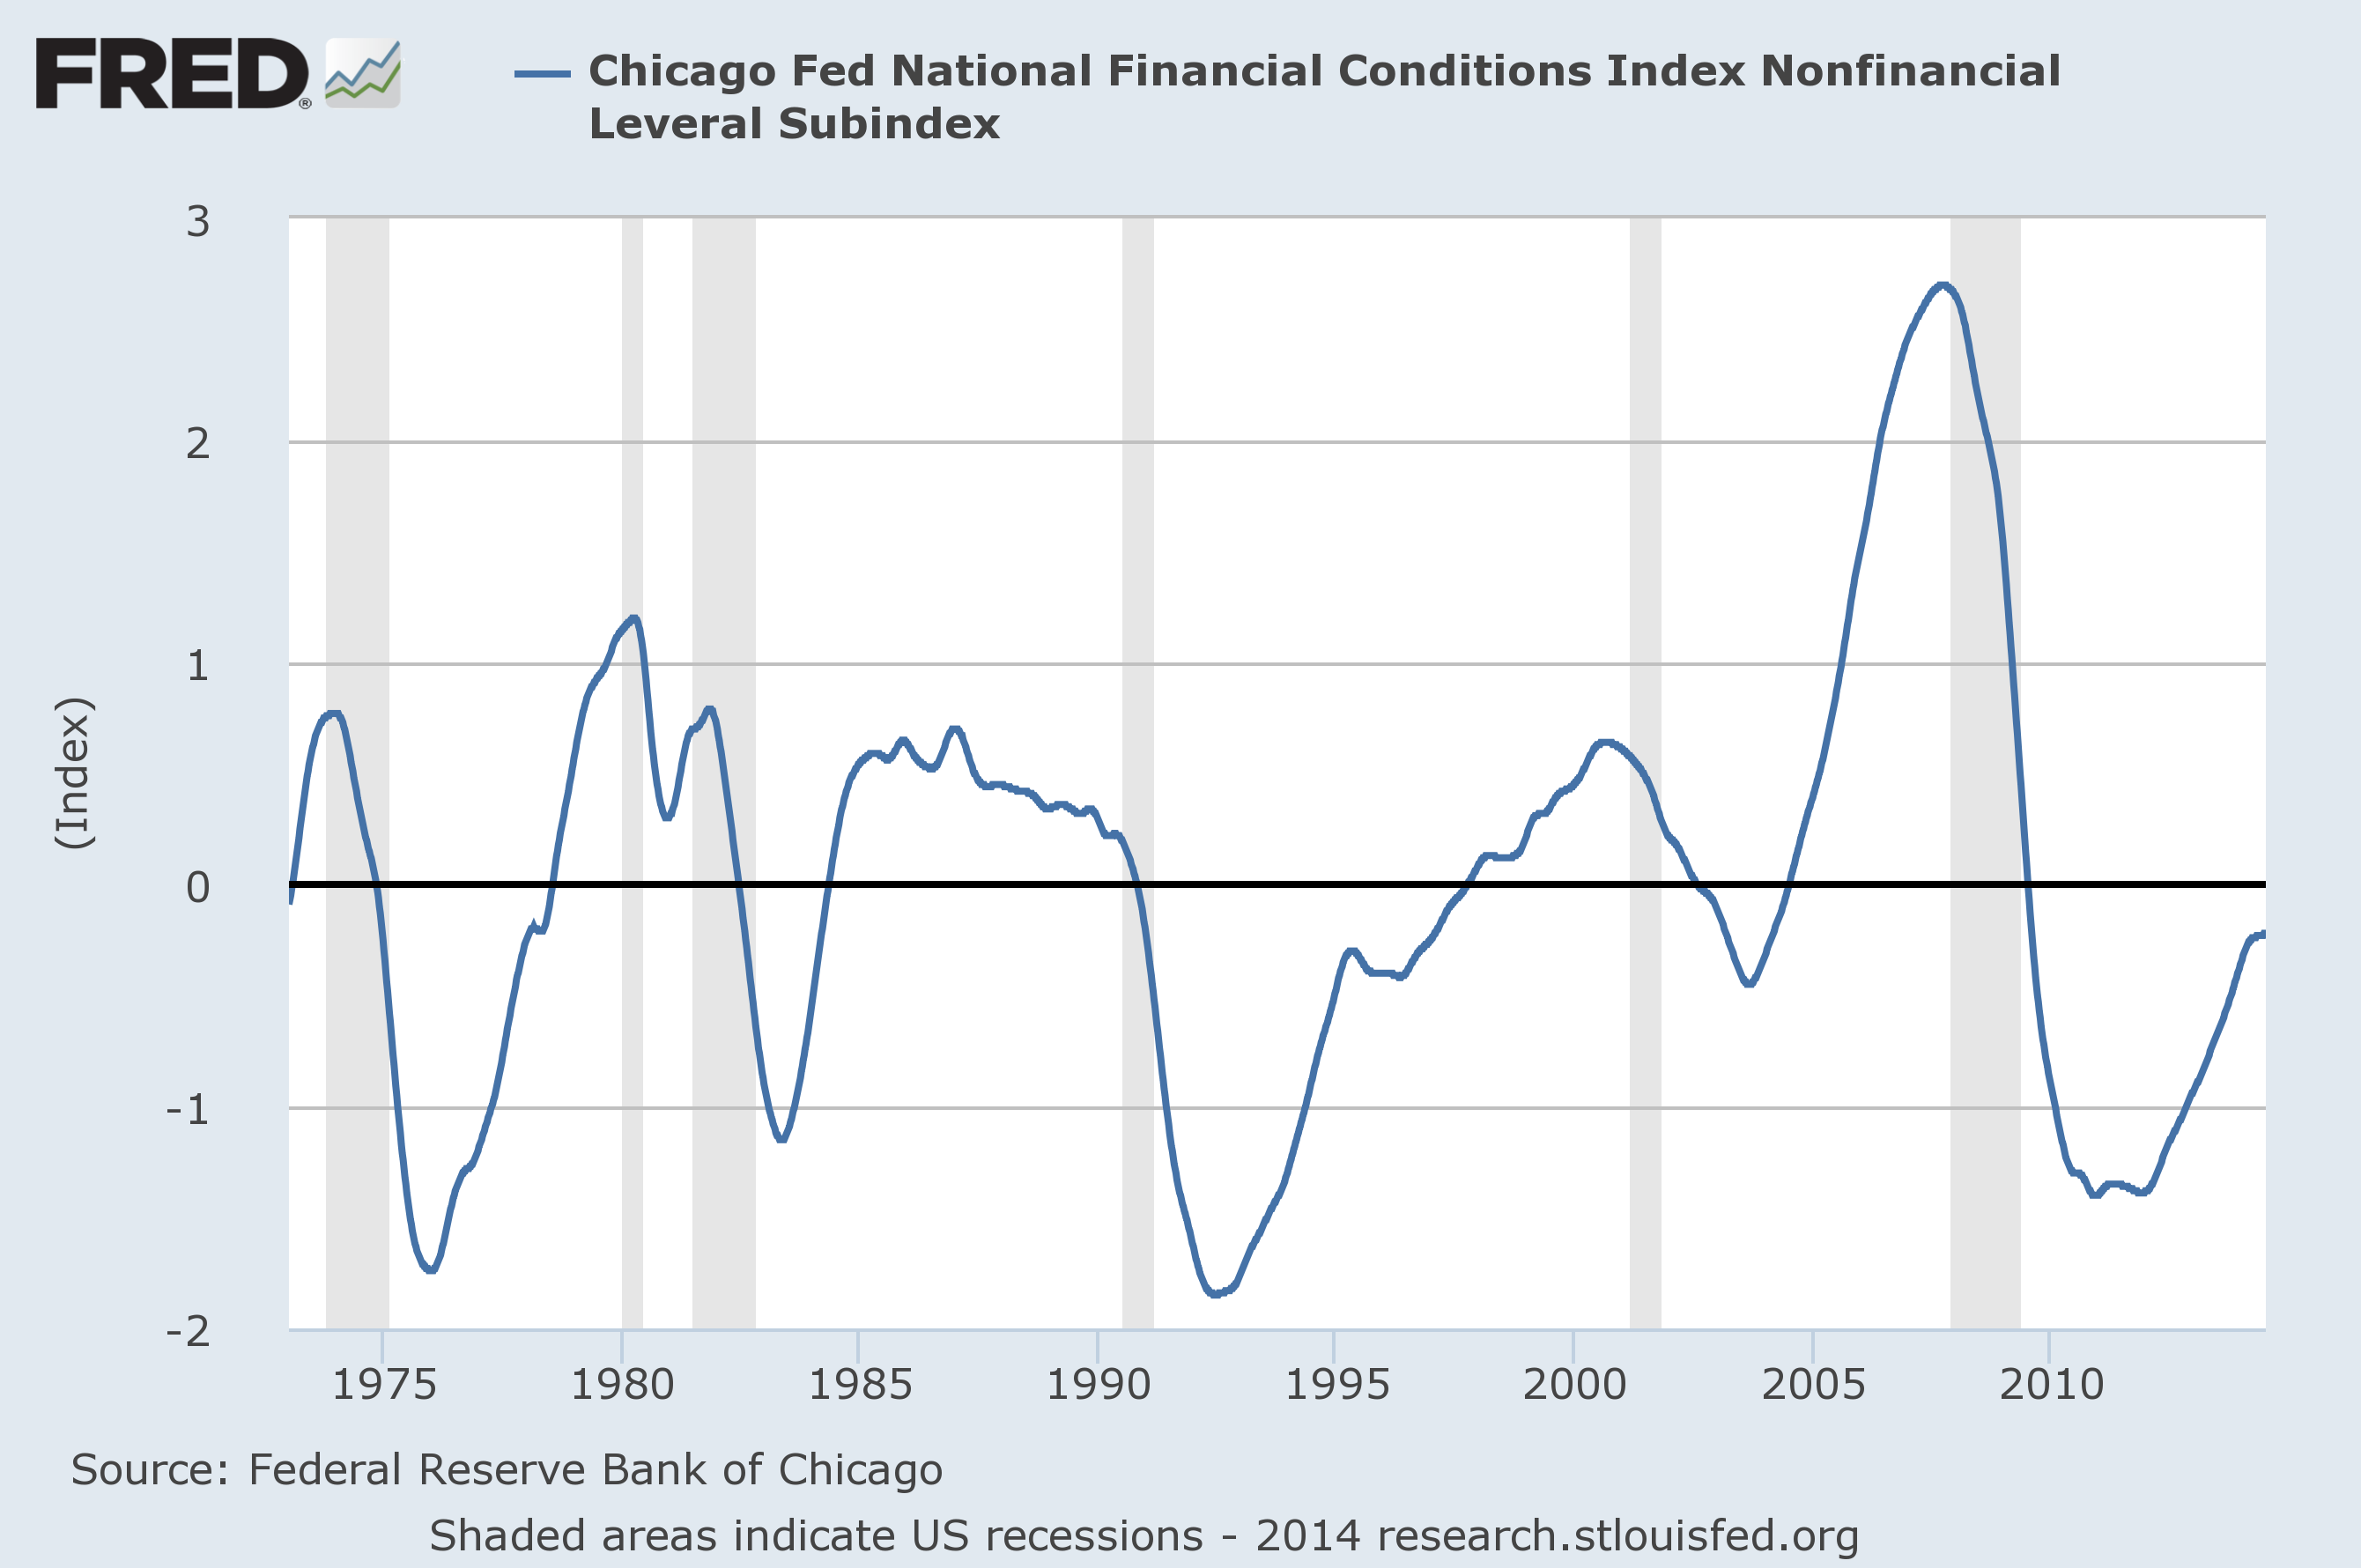
Monetary conditions to remain easy

When the Fed will start to raise interest rates and reverse its QE program has been a constant source of speculation. While such speculation may intensify over the next six months – resulting in bouts of volatility for investment markets – global monetary conditions are set to remain easy:
  • The tightening US jobs market indicates the first rate hike in the US is coming on to the horizon. But continuing high levels of excess capacity indicate it may still be 9-12 months away and will be a gradual process when it starts. In other words it will take a long time before US monetary policy is tight – with above “normal” interest rates and short term rates being above long term rates.
  • The ECB has only just eased monetary policy and has signalled it stands ready to do more, including via a quantitative easing program, if deflation risks don’t recede. Rate hikes are well over the horizon.
  • Unprecedented quantitative easing in Japan will continue until underlying inflation is firmly ensconced around 2% and there is still a way to go. Rate hikes are not in sight.
  • In Australia, the RBA is not expected to start raising rates till sometime next year. And as the Fed is likely to go first, the Australian dollar is likely to resume its downtrend.
While there will be a few bumps regarding the Fed (just like last year’s taper tantrum) the monetary backdrop is set to remain supportive for investment markets.

Investor sentiment a long way from excessive

We remain a long way from the sort of investor exuberance seen at major share market tops. It seems everyone is talking about share market corrections and crashes and tail risk hedging seems all the rage.
In the US the mountain of money built up in bond funds during the post GFC “irrational exuberance for safety” has yet to really reverse.
Source: ICI, AMP Capital
And in Australia, the amount of cash sitting in the superannuation system is still double average levels seen prior to the GFC and Australians continue to prefer bank deposits and paying down debt to shares and superannuation. There is still a lot of money that can come into equity markets as confidence improves.
Source: Westpac/Melb Institute, AMP Capital

Concluding comments

After a bout of relatively smooth sailing there will inevitably be a correction at some point. There are plenty of possible triggers: geopolitical risks, the risk of an inflation/Fed rate hike scare, deflation in Europe, the property slowdown in China and in Australia the transition to more broad based growth.
However, while investment returns are likely to slow, still reasonable share valuations, gradually improving economic conditions, easy monetary conditions and a lack of excessive optimism suggest further decent investment returns ahead.


Sunday 20 July 2014

Prime London Rents to Rise, Prices to Catch Up in Suburbs

Stage 1: Prime Central City Always Recovers First, Year 1 - 3 From Trough

Panoramic views from a penthouse overlooking Central Park, Manhattan New York, US. Do You Have US$10m to Spare Sir/Madam?


The pattern of recovery is the same which ever city you go to. When the property market hits the trough, the prime central area will always shoot up first. Rental yields usually plummets because rents cannot catch up. This happened in 2009. After 2 - 3 years of recovery, price appreciation slows down. This happened in 2014. This is because fewer and fewer people can afford to buy Prime Central London, or Orchard Road, Districts 1, 2, 3, 4, 10 and 11, or Manhattan New York. Sure, there will be occasional cash buyers by the Malaysian Datuks, Russian Oligarchs, Chinese tycoons. They don't need any mortgages. But there will also be pure investors who are keen to leverage to increase their IRR. I believe the make up of Prime Central London investors are as follows:

1. 40% foreign investors who don't need mortgages.

2. 20% foreign investors who need mortgages.

3. 25% Local investors cash buyers.

4. 15% Local investors who need mortgages

Since the gross yields are less than 3%, well below borrowing costs, it becomes more feasible to rent than to buy. Bare in mind that 35% of buyers will need mortgages and will find it difficult to get bank approvals. a 35% drop in demand without a corresponding fall in supply will almost certainly lead to a drop in prices.

At this point, the inner and outer suburbs, such as zones 2 and 3 in London, Brooklyn and Queens of NYC, Rest of Central Region like Geylang, Newton, Novena, Balestier, Tiong Bahru will not move much. This is because the domestic economy is still recovering. Employment is still falling, hence few have the budget to upsize their homes.

Smart investors will start to target the outer and inner suburbs in anticipation of faster growth and the higher yields. While the outer/inner suburbs may not allow tenants / dwellers to walk to work, it is usually just a 10 - 30 minute commute via train / bus / drive away. Inner suburbs are usually 1 - 7km from the CBD. Outer suburbs usually 8 - 14 km away. Gross yields in inner suburbs will usually 5% and outer suburbs 6%. Cashflow is usually positive with leverage.

Dublin, Madrid, Barcelona, Miami, Houston, Phoenix, Las Vegas, San Francisco, Seattle, Birmingham and Brisbane are in this phase.

Stage 2: Inner and Outer Suburbs Start to Recover Years 4 - 6

"Character Homes" in London Suburbs. They May Be Over 80 Years Old But Have Share of Freehold. Definitely Worth Over GBP500k or SGD 1m! Just 10 - 30 Minutes of Commute To CBD or Work Place


From 2013, Zone 2 and 3 London began to stir. Singapore's RCR region stirred in 2010, a little earlier. Brooklyn and Queens hit the trough at around 2013.... Domestic economy starts to recover. Banks start to loosen their mortgage lending standards, fuelling widespread price rises.

People who need to work in the CBD, who work long hours, usually from the Finance, Oil & Gas trading sectors need to get to work in the wee hours of 0730hrs. they cannot commute from more than 15km away, especially if the public transport is not efficient. They will be forced to rent in Prime Central / Inner / Outer suburbs. The corporate leasing sector will revive and boost rentals in central region.

Those who just entered the workforce will also choose to rent in the central/inner/outer as well, because it will mean a more "happening" place to be, lots of drinking holes and nice restaurants in the city, and a quick stumble home with a babe in arms after a titzy, alcohol fuelled Friday night out.

Families who are climbing up the financial ladder may try to move close to the CBD, and buy a home in the inner/outer suburbs nearer good schools. The make up of inner / outer suburb buyers are usually:

1. 20% foreign investors cash buyers.

2. 20% foreign investors with mortgages.

3. 20% local investors cash buyers.

4. 40% local investors with mortgages.

New supply is beginning to be completed. Housing starts reach all time high. There will be signs of oversupply in certain areas. In London, it could be in the Eastern suburbs. In Singapore, it could be Tampines, Woodlands and Jurong. In Malaysia, it could be Mont Kiara.... But overall, vacancy rates are still very tight.

Oh and most governments, post GFC will start to implement anti speculative measures to prevent another property bubble wreaking havoc. You can count on it. It's too fresh in the policy makers' memories.

Rents for CBD will start to creep up quickly due to corporate lets increasing. Yields will start to rise from 2% back up to 3%. Inner suburbs will see yields drop to 4% and outer suburbs 5%. Cashflow for inner/outer suburbs will either be neutral or slightly negative, a danger signal of a market peak coming in 3 - 4 years.

I would say that London has entered phase 2. Melbourne is definitely well into phase 2. Sydney is in early phase 2. New York as well...

Stage 3: Spill Over to Regional Areas, Cries of Bubbles... Years 7 - 9

 15 km From CBD, Usually With No Public Transport System. You May Take Over One Hour Of Journey Commuting To Work Daily. Good Regional Areas Are Near Good Schools But Shopping and Dining Choices Are Usually Limited. Mainly Owner Occupiers Who Are Families...


By year 7, governments will implement increasingly punitive measures. CBD will see yields of around 3% still. Although there is increased rental demand, supply has also increased as all the off plan properties are finally completed from year 7 of the cycle. Prices in the CBD could start to rise again and investors again find the negative cashflow more tolerable, as the job market improves. But this is merely a flash in the pan. In this phase, interest rates and borrowing costs are usually extremely high as the economy enters the late stage of the cycle.

Inner/outer suburbs have become unaffordable for most locals. Pockets of oversupply have spread to larger areas. Rumours of huge drops in rentals as contracts are renewed. Vacancy rates rise rapidly, void periods increase. Rumours of bankruptcies and owners who cannot afford to keep up with mortgage payments surface.

Singapore, KL, Iskandar, Manila, Beijing, Shanghai, Guanzhou, most Asian cities have entered this dangerous phase.

Investors should decide whether to take profit if they entered in stages 1 and 2, and are sitting huge profits. My advice is this: If the fundamentals of your suburb is right, e.g. infrastructure like good schools, shopping, food, train stations nearby, you should hold it and remortgage to get equity cash out. Most astute property investors hold their properties for over 10 years, or 2 cycles.

Gross yields in inner/outer suburbs will be around 3% / 4%, and definitely negative cashflow. Most families will sell up their apartments as their families grow with more kids, and move to the regional areas for more space.

The only time you should sell or take profit is when:

1. Massive oversupply still coming on stream. This is usually due to poor planning by the local government. E.g. Iskandar. It will bring your rents further down and make it difficult to service your mortgage. The oversupply could exaggerate the decline and prolong the downturn. Take for example properties in Newham and Tower Hamlets. They fell by over 30% since 2006 vs Prime Central London which fell by 15%. Since Prime Central London recovered in 2010, they were in the doldrums until 2013!

2. Infrastructure is in decline or about to be removed. This is rare as most schools, train stations will remain for decades to come.

3. Crime rate increasing, unemployment in the area rising. This is a sign of urban decay, as the local council mismanages the borough. Generally, this doesn't exist in Singapore. But it is prevalent in other cities, notably KL, Iskandar, NYC etc.

I usually don't recommend selling off your properties unless the fundamentals have changed. As Warren Buffett said, the best time to hold your stock is forever.

How I Analyse My Investments

I am passionate about investing, especially property, stocks and bonds. I have spent hundreds of hours understanding how data can be used to give me the edge on selecting stocks, bonds and cities / suburbs that will experience above average growth.

I believe that whatever my investment vehicle is: shares, property, business, forex, commodities, etc. - it all comes down to risk and return. For every property I buy, I draw up a detailed spreadsheet calculating my return on investment. Every spreadsheet has revealed just how important capital growth is. So that is where my focus has been. I want to apply the best research possible to maximise profit.

For properties, I'm not happy finding a good location.... I want the best cities in the world, the best location in the city. That requires tremendous amount of research. When researching my next purchase I try to use as much data as possible. I want every little bit of data working for me... and I scrutinise and qualify each. I believe it is possible to know a market better than a local without even visiting. The visit is the icing on the cake.

Prices move in response to changes in supply and demand. This is not only true for property, but for any investment asset. My research is based on finding locations with the highest future demand to supply.

It has been said that risk is ignorance. For example, the risk of buying some shares is that you don't "know" if they're going to go up or down in value. Not knowing what will happen, means there is risk. Therefore, the more you know conversely the less risk. It's also the quality of information that gives you the edge where others "in the know" may not.

Use this procedure to know as much as you can and to create a system for uncovering stocks / bonds / suburbs with the best potential for growth. It can be used to validate those hot tips that you might receive from friendly agents, brokers or relatives. If you're diligent and determined, you should get great results. You're certainly going to be a step ahead of most other investors which is crucial for getting in at the front end of any future growth.


What Singaporeans Should Be Buying But Because of Stupidity Or Laziness, Are Not Doing So...


These are examples of gorgeous houses and apartments that you can buy with S$1.3m. In Singapore, you can just about afford a 1000 sf condo in outer suburbs like Tampines or Jurong. Your child will have no space to run but watch TV and play computer games all day. In other countries, your child can expand energy by playing in the garden with the pet dog! Guess why 80% of Asian kids wear glasses?

1. 64/123-125 Macquarie Street Sydney (Built in 1923!)
 
A timeless offering of unequalled elegance and sophistication in a landmark community, this exquisite residence effortlessly balances period grace with stylish ultra contemporary necessity. Beautifully refurbished over approximately 92sqm, it is metres to the sweeping grounds of the Royal Botanic Gardens.

- Communal roof terrace with stunning harbour views

- Soaring 3.2 metre ceilings, traditional appointments
- Grand entrance foyer, polished timber floors, ample storage

Built in c1923, this grand building was the first high rise residential complex in Australia. With an unrestricted company title that allows for rental, it is just a short stroll to the Opera House, cinemas, cafes and the heart of the city.


http://www.realestate.com.au/property-apartment-nsw-sydney-116881335


2. 3LDK House to Buy in Meguro-ku

http://www.realestate.co.jp/en/forsale/view/252533

Tairamachi 2-chome Hosue 1

Price: ¥105,000,000 (US $1,050,000)

Disclaimer
Land Rights:Freehold
Occupancy:N/A
Gross Yield:N/A
Type:House
Floor:1 / 3F
Size:126.07 m²
Location: Meguro-ku, Tokyo
Nearest Station: Toritsu Daigaku Station
4 min. walk

6.3km from CBD. Built in 2010. No maintenance fee because it's a terrace.


Bubbles Are Emerging In Some Pockets...

Illogical Decisions and "Heuristics" that my friends / clients make

In my engagement with investors / clients, I realise the severity of the misjudgement they have over major risks. This type of judgemental error is called "HEURISTICS". https://sg.finance.yahoo.com/news/23-daily-habits-smarter-174229976.html    For example:

1. Singapore is a safe country and will never falter. This is a fallacy. The current government in Singapore is fast losing popular support because it is losing touch with the citizens. Global warming will put Singapore's water and food supply at risk. Singapore's neighbours are unpredictable at best. The recent announcement to reclaim land in the sea along the second link has caused environmental and territorial concerns.

2. Singapore's property prices will always go up. This is another fallacy. The government has planned enough housing for seven million people! Never again will authorities make the same mistake as in 2003 - 2011, or 1990 - 1997, when they failed to anticipate population growth.

I foresee Singapore's property prices to fall by 15 - 30% from now till 2016 before making a slow rebound. Going forward, Singapore's property prices will appreciate by 5% per year, in line with nominal GDP growth. It will never create household wealth like it did for the older generations.

3. I've been bearish on Iskandar property since 2012, but only like land. I was ridiculed and questioned by many readers and friends. Many just rattled about the infrastructure that will be built. But they forget that a leopard will never change its stripes. It's still the same government in charge. in the 1970s thousands of Singaporeans piled money stupidly to buy Desaru and JB properties. Many of the condos were never completed. 40 years later, a different bunch of Singaporeans are getting conned.

Bubbles are emerging slowly

Let me make this clear, I don't see a bubble even in the S&P500. Valuations may be rich, but interest rates are still rock bottom, which will fuel further rises. S&P500 has around 10 - 15% upside over 12 months.

But I do see "mini-bubbles" forming in real estate in China, Singapore, Indonesia, Philippines, Thailand etc. Mostly Asian cities. We may see more Asian developers defaulting as sales of off plan properties slow.

I do see London being "fairly valued", and some Australian cities like Melbourne and Sydney, although still cheap in terms of income multiples, have negative carry over mortgage rates. Most Australians prefer to buy not rent properties. Also, there is no shortage of condos or what they term as "units" in Australia.

There are no bubbles in the US, Ireland and European real estate sectors. These sectors are the safest area to invest in the mean time.

Increasingly, there are fewer and fewer things to invest. I can't wait for the US to hike short term rates so that it will hit those who are over leveraged. I can then pick things up cheap.

We are 2/3 of the way to our next recession. The last time we had one was in 2009. The US emerged from recession in 2010. The EU in 2013. I see 3 more good years before the next downfall so do play safe in your investments and keep lots of ammunition. If you're invested in balanced funds, keep your OD line half or 1/3 utilised because there will be a lot of opportunities in the next 3 years.

Anyway, below is a good article about Prof Shiller's points about market bubbles.

www.gurufocus.com/news/268267/double-bubble-toil-and-trouble

Tuesday 15 July 2014

Financial Market Cycles in 2015

The article below accurately describes the usefulness of fundamental analysis: It is not useful for short term forecasting, e.g. 1 year. It is a lot more useful for a longer term return forecast, e.g. 10 years.

Nevertheless, from the CAPE ratio for S&P500, evidence are mounting that we are in the second half of the bull run. I'll venture further forward to say that we are 2/3 of the way to the end. My view is this:

1. EM and Asian equities may outperform developed markets from 2014 - 2016. I especially like Chinese cyclicals now.

2. Sectors and markets that peaked in 2011 and dropped 30 - 40%, e.g. mining sector will outperform.

3. Technology and banks will also outperform.

4. US, Europe and Japan will still notch new highs from now till 2016, but will not be at the same rate as the first 2/3 of the bull run, from 2009 - 2014.

What are the signs that stock markets have peaked? They are:

1. The signs are the same, whether in 2006, 1999 or at any point in history. The respective sovereign yield curve will invert.

2. Inflation will begin to tick up, causing governments to hike rates in order to tame inflation.

3. Eventually, the economy will slow, prompting investors to flock to longer term treasury bonds, pushing yields below the short term rates.

4. But does it apply in today's "artificial markets"? I'd use the Taylor rule. It now states that the Fed Funds Rate should be at 2%. The 10-year US Treasury is at 2.54%. The yield curve is rather flat, but still normal sloping.

5. The yield curve won't invert until US unemployment falls below 6%, wages rise and inflation rises. I don't see this until 2H 2015. I foresee the US FFR reach 1% end 2015, 2.5% end 2016. The Taylor Rule rate should be 3% by end 2015, almost inverting the curve. It will reach 4.5% end 2016. In fact the yield curve according to Taylor's Rule will invert sometime in 1H 2016 and the US govt will be in denial that there will be a recession soon.

Between now and 2016, I favour the following asset classes:

1. For bonds, I prefer Asian high yields because the yield curve is flattest in Asia. I'd go for Fidelity Asian High Yield.

2. For balanced funds, I prefer JPMorgan Multi Income.

3. For equities, I'd go for Fidelity Global Dividends, First State Regional China, First State Global Resources, Henderson Tech, Aberdeen Europe.


Don't Listen To Bubble Speculation
Disclosure: The author has no positions in any stocks mentioned, and no plans to initiate any positions within the next 72 hours. (More...)

Summary

  • It's not worth investor's time to listen to the endless bubble speculation. Most of the arguments in support of a market bubble are weak.
  • Valuation measures cannot help with market timing; they work well only when considering long time periods.
  • Economic data does not indicate an imminent recession.

As you can see above, the Dow has spent the last week or two hovering around a significant numerical milestone. In fact, there were several days when the Dow closed above that value leading to a flood of poorly thought out doomsday articles (here's a particularly bad example of a doomsday article). In spite of the nonsense, we can still learn something from all of the noise the financial media is generating; specifically, what not to do. All investors are human and are therefore subject to cognitive biases when making investment decisions. When cognitive biases are mixed with the misunderstanding of valuation metrics, the result is usually bad decisions. I'll start with the misunderstanding of valuation metrics.
(click to enlarge)
Source: data provided by Robert Shiller, graph from multpl.com.
The chart above is Robert Shiller's CAPE (Cyclically Adjusted PE) ratio. CAPE has been in the news a lot over the last few years; however, if you are not familiar with CAPE, here is a brief summary. CAPE is calculated using a 10-year, inflation adjusted, moving average of the PE ratio. The moving average allows for much of the short-term volatility to be filtered out, providing a much better indication of the long-term potential for the stock market. The long-term average value for CAPE is 16.54 and the current value is 26.06; about 57.55% above the long-term average.
In fact, the overvaluation suggested by CAPE has a lot to do with the amount of attention it has been given in the last year or two. There are several metrics that indicate the market is currently overvalued, but CAPE was one of the first indicators to suggest the market was overvalued. With the significantly negative bias in the media's market outlook and the many pundits calling for a crash, CAPE became the indicator of an imminent crash. The problem is that CAPE is not a tool for timing the market, to see that, consider the chart below.

Source: Bloomberg View.
There is no better way I can think to make the point. The current value of CAPE has very limited predictive power over a 1-year time span. Also, keep in mind that the chart is showing median returns; it's not an absolute predictor of returns. CAPE is telling us that we should expect stocks to do poorly in the long-run at current valuations, but it's not saying anything about a correction, crash, or a bubble. I would also suggest caution when working with valuation metrics such as CAPE; it's best to use more than one before you decide if the market is overvalued. My final point on valuation metrics is that they all suffer from the same problem that CAPE does, to a great extent. There are no measures that can tell you when a crash or correction is coming.
Now, you may argue that there are other reasons to believe that there is a market bubble other than CAPE: QE, length of the current bull market, the VIX, all time highs, economic ruin, and so on. I've already addressed the VIX in a previous article, so I will not cover that here. With respect to the others, I will direct readers to one of my favorite articles about the problem of storytelling in the context of investing (The Narrative Fails). However, I will provide a few data points that indicate the economy continues to move in the right direction (and therefore is not going to cause a market crash).
(click to enlarge)
First, the unemployment rate has continued to decline, though it remains elevated. Clearly, unemployment is moving in the right direction and does not show signs of stalling or reversing. Even if we expand unemployment to include marginally attached workers (chart below), the situation is still improving. Given the magnitude of the financial crisis, it's not hard to believe that the recovery will take much longer than for a less serious recession. Furthermore, the improvements in both measures of unemployment appear to be accelerating. While I can't predict the future, that certainly doesn't fit with the idea of a slowing economy.
(click to enlarge)
This leads me back to the point I mentioned above about the narrative. Much of the doom and gloom outlook on the economy is politically motivated. It doesn't matter what your political views are; keep them out of your investing decisions.
(click to enlarge)
There is one final point I would like to make about the absence of a market bubble. The chart above is the National Financial Conditions Index (NFCI) subindex (one of three) measuring nonfinancial leverage. From the Federal Reserve website:
The three subindexes of the NFCI (risk, credit and leverage) allow for a more detailed examination of the movements in the NFCI. Like the NFCI, each is constructed to have an average value of zero and a standard deviation of one over a sample period extending back to 1973. The risk subindex captures volatility and funding risk in the financial sector; the credit subindex is composed of measures of credit conditions; and the leverage subindex consists of debt and equity measures. Increasing risk, tighter credit conditions and declining leverage are consistent with tightening financial conditions. Thus, a positive value for an individual subindex indicates that the corresponding aspect of financial conditions is tighter than on average, while negative values indicate the opposite.
The nonfinancial leverage subindex of the NFCI best exemplifies how leverage can serve as an early warning signal for financial stress and its potential impact on economic growth. The positive weight assigned to both the household and nonfinancial business leverage measures in this NFCI subindex make it characteristic of the feedback process between the financial and nonfinancial sectors of the economy often referred to as the "financial accelerator." Increasingly tighter financial conditions are associated with rising risk premiums and declining asset values. The net worth of households and nonfinancial firms is, thus, reduced at the same time that credit tightens. This leads to a period of deleveraging (i.e., debt reduction) across the financial and nonfinancial sectors of the economy and ultimately to lower economic activity.
Just one more sign that we may not be on the edge of a cliff. No recession, in the data provided, started when the leverage subindex had a negative value. It provided a good warning about the financial crisis and some degree of warning before the dot-com bubble burst. The economic data points to continued recovery, not recession.
Just to be clear, I'm not saying that there will be 10 more years to this bull market. My point is simply that claims of a market bubble are fairly weak. Even if there is a bubble, I would be willing to bet that most pundits are wrong about the reasons, and they only get the timing correct by luck. That's just how the market works; it's only easy in hindsight.

Sunday 13 July 2014

Property Market Cycles: 2015 Will Be A Year of Reckoning Part 2

Part 2 of my posting is this:

Property investing will be more difficult post GFC.

The world's leaders have seen the devastating effects of a property bubble burst. Asia saw it in 1997. The western world ex Japan and Australia saw it in 2008 - 2014.

Most countries, e.g. Singapore, implemented something called the Total Debt Service Ratio or TDSR, which dictates that mortgage payment cannot be over a certain percentage of borrowers' income. In addition, Singapore increased buyer and seller's stamp duties.

I believe the TDSR is a prudent ruling as it incorporates all forms of household debts e.g. unsecured loans, auto loans, credit cards, as a percentage of income.

Although Hong Kong, Malaysia and China implemented other forms of measures, such as capping the max LTV, but not TDSR, they are closely watching the effectiveness of Singapore's measures.

In the UK, the MMR has had a similar effect. Like Singapore, it assumes the mortgage payments are based on an average interest over the last 10 years!

Here's the trillion dollar observation: If the MMR / TDSR is implemented by most governments worldwide, property prices will be linked to wage rises or wealth of households! No more will we see run away property prices like in 2003 - 2006, or in 2013 in the UK.

The only exceptions are:

1. when buyers pay full cash. The TDSR or MMR will have little impact on reining in property prices.

2. When buyers take on less debt, less LTV, and more cash, prices will be able to run more.

The volatility of property prices in the UK, Singapore and other countries that strictly enforce the TDSR / MMR / watchamightcallit will rise at a pace of 3 - 6% per year.

What will happen in 2015?

Interest rates will start to rise from Malaysia, New Zealand, followed by the UK, then Singapore and the US in the latter part of 2015. Australia is likely to hike rates too.

For countries like Singapore and Malaysia where there is oversupply. The effects can be devastating. Rents will fall and owners be stressed to pay off mortgages.

For countries like the UK where there are still acute shortages, it will slow down appreciation and more will be forced to rent. The rapid rise in rental will partially offset the rise in mortgage payments.

For countries like the US and Europe, property prices will rise unabated as rental yields are still way above borrowing costs...
 

Property Market Cycles: 2015 Will Be A Year of Reckoning

The boom and bust of real estate cycles seem to be tamed. That's because post GFC, governments realise how much havoc a burst property bubble can cause. Unlike stocks, properties are often the biggest ticket item for any household. A typical property usually cost around 2x of an American household's annual income, and as much as 18x a Chinese household's annual income. Most buyers need mortgages to buy a home. This means that banks' mortgage policy is a big determinant of house prices.

Let me state the biggest factors of a housing cycle:

1. Availability of mortgages. The TDSR in Singapore and Mortgage Market Review (MMR) in the UK have successfully curbed house price inflation.

2. Borrowing costs. If rates rise beyond rental yield, prices tend to stop growing as it will be cheaper to rent than to buy.

3. Employment creation. Jobs growth spur population growth, which in turn spurs household formation.

4. Supply factors. How liberal are local governments in giving permits?

In London, the MMR has caused asking prices to be reduced. MMR currently restricts loans that are > 4.5x of a household's income. If a typical London household earns around GBP50k, most banks will not be comfortable lending beyond GBP225k. This means most of zones 1 to 3 are priced beyond the reach of most Londoners.

As a result, London's house price appreciation will follow what Singapore went through between 2011 - 2013, slow growth. House price appreciation will follow wage rise since one will find it difficult to borrow > 4.5 x of a household's income.


Sunday 6 July 2014

Investing Abroad.... How Housing Projects Can Become Abandoned

A client recently told me that she invested in a condo in JB in the 1990s. Initially, the yield was very high, to the tune of 10%. After about 8 years, with yearly increase in rental, she recouped her capital. However, from the fourth year onwards, the building began to look tired. Maintenance deteriorated.

Many owners failed to pay service charges or conservancy fees. Soon, lifts stopped working. The final straw was when water and electricity supplies become intermittent. Slowly, more and more tenants, home occupiers began to desert the condo until it became abandoned. You can own a piece of real estate in JB, Melaka, Ipoh, even Bali, Detroit and Chicago, they are worthless today and can be purchased for $1.

I operate mainly in developed countries, where the rule of law is strong. I prefer to invest in countries like Australia, the US, UK, Japan, New Zealand, Hong Kong and Singapore. If I were to invest in Malaysia, Philippines, Thailand etc., I require double the IRR compared to developed countries. Since I achieve around 15% returns p.a. for my financial investments, I require 30% higher returns for real estate, or 20% IRR to compensate for the lack of liquidity. For third world countries, I require at least 40% IRR.


Feb 8, 2012
    table_add Comment    email_go E-mail to friend    share Bookmark & Share
Syarikat Perumahan Negara Bhd (SPNB), a government agency established to rehabilitate abandoned housing developments, will no longer revive such projects due to a change in the policy.
Under the new policy, abandoned residential projects will be entirely managed by the Housing and Local Government Ministry via the Commissioner of Buildings, said Datuk Dr Kamarul Rashdan Salleh, Managing Director at SPNB.
"I understand that the ministry will work with private developers to revive abandoned houses," he said.
However, Kamarul is concerned over the rising costs to restore housing projects from private developers, including low or medium-low-cost houses, due to the requirement to keep the original house price.
For medium-cost housing, attracting private developers is not a problem, as competitive prices can be set and substantial profit can be made, he noted.
"Efforts to revive low-cost and medium-low-cost houses do not guarantee lucrative profits. Furthermore, developers will have to put up with spiralling costs."
"If the developers are willing to the risks, I welcome their initiative to do so, but if it is too risky for some developers, then the government has to come up with a workable mechanism to develop abandoned housing projects," he added.
SPNB will begin reviving Taman Jasa Amir and Taman Tangkak Emas abandoned projects in Johor by next month, as these projects have been idle since 2005.
Image: NST.com.my


Mar 19, 2012
    table_add Comment    email_go E-mail to friend    share Bookmark & Share
Greedy developers are the primary cause of many abandoned housing developments in Johor.
There were 12 abandoned developments comprising of over 4,616 residential units, said Datuk Ahmad Zahri Jamil (pictured), Chairman of State Local Government and Housing Committee.
"They (greedy developers) want to finish their projects early to make huge profits without having a strong cash flow," he said.
The Johor Baru district has the most number of abandoned projects with four in Taman Mewah Jaya, Taman Desa Larkin, Taman Seri Baiduri and Taman Cahaya Kota Puteri.
Next is the Ledang district with three abandoned projects in Taman Sri Emas 7, Taman Sri Nilam and Taman Tangkak Emas. Meanwhile, Batu Pahat district’s three abandoned projects were situated in Taman Emas Surya, Taman Jasa Amir and Bandar Putera Indah.
For the Kluang district, the two abandoned projects are located in Taman Sri Layang-Layang and Taman Mengkibol.
"Several steps have been taken to revive these projects," said Ahmad Zahri in a reply to Ng Lam Hua (DAP-Mengkibol) during the state assembly meeting last Friday.
New developers had been chosen to take over the development with one developer appointed by the state government while eight developers appointed by the Housing and Local Government Ministry.
The ministry is still finalising the selection of new developers to revive the projects in Taman Sri Layang-Layang in Kluang, Taman Emas Surya in Batu Pahat and Taman Mewah Jaya in Johor Baru.
"We have to make sure that it is a win-win situation for both the new developers and house buyers," he added.
For the latest property news, trends, resources and expert opinions, visit our Property News section. Home buyers, sellers or property renters looking for Malaysian Properties, may like to visit http://www.homeguru.com.my today.