I recently attended an exhibition by a well-known property agency marketing new apartments in central Tokyo. Let's just say that the area where the apartment is located starts with the letter "M". The seminar started off very well, with the speaker highlighting Tokyo's economic importance, growth, and population growth. One area which I disagree very strongly was his assertion that USDJPY will drop (Yen strengthen) when economy strengthens. I then asked him how the price of the apartment compares against the older ones and he could not answer.
When the seminar ended, I approached two agents, who then showed me the unit layout, the price, and financing. However, when I pressed on with my questions on 1) how to compare against transacted properties in the same neighbourhood, the agents froze because there simply isn't any data. 2) I asked if the difference between off plan and a 10 year old property is around 25% (see chart below), how could I make money after 10 years? Instead of appreciating by 7% per year right from the start like I will in London or New York City with existing properties, I will only enjoy 25% or only 4% per annum because depreciation is another 3% per year! In fact, a 30 year property is 60% cheaper than an off plan!! I might as well hit the sweet spot.
The other area which I could not contend with is the earthquake risk. New building technology apparently allows buildings to withstand up to 7 Richter Scale.
According to the BBC article, a team of researchers from the University of Tokyo said there was a 75% probability that a magnitude 7 quake would strike the region in the next 4 years. The article was written on 23 Jan 2012. If they are right, there are only two more years before the BIG one hits. The Japanese government is more moderate, saying the chances are 70% in the next 30 years. A magnitude 9 earthquake is a possibility, and the nuclear fallout from Japan's plants will be unimaginable. Even if the building is still upright, it could be damaged and unfit for occupation.
Finally, my other worry is Abenomics' lack of third arrow of reform. There is just no willingness to open up the economy to foreigners. The demographics is such that the population will continue to shrink from 123 million inhabitants to around 100 million in 10 years. Tokyo will also decline in population inevitably, or see little growth. Rents will not increase and vacancy rates could rise.
What tickled me was that the agents told me point blank that "if I'm not keen to buy please leave the room!" which I promptly did. I've never met such unprofessional behaviour, employing hard selling tactics unheard since the 90s.
From JapanRealEstateWiki
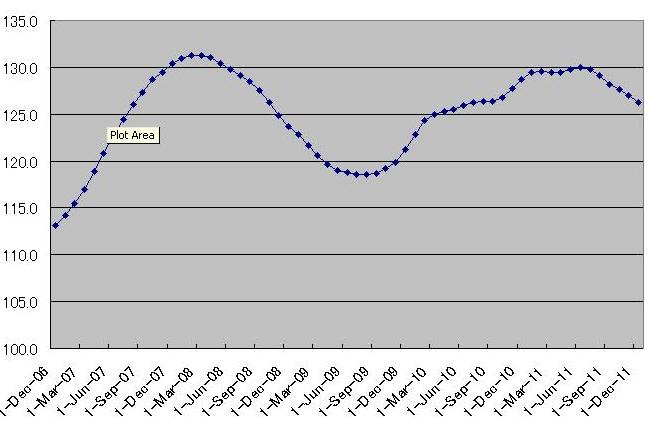
The Akasaka Real Estate Price Index indicates the latest trends in central Tokyo apartment prices.
It shows the asking square meter price of an average 20 year old apartment in the 4 most central wards of Tokyo: Minato-ku, Shibuya-ku, Chiyoda-ku and Chuo-ku. It is updated several times a week and corrected for the age of the units on the market. It is not corrected for inflation.
Time Series
To get the updated time series for this chart click
here. I will take a minute or two to generate.
Asking Price
In Japan there is no central registry of real estate transactions and as such the transaction prices are only sporadically known. There are however several websites listing properties on the market. For central Tokyo these data sources are comprehensive and the data set is rather reliable. Given that the discount on the asking price is fairly constant at about 5% of the lowest listed price it makes sense to use the largest and most reliable data-set in Tokyo to calculate the trends in property prices.
Apartments
Traditional ways of measuring property prices in Japan involve measuring land prices. The advantages of measuring apartment prices instead are:
- In Tokyo there are many more apartments than pieces of land and houses for sale. With more data it is easier to create reliable statistics
- Land prices are dependent on the zoning, size, shape of the lot and direction of the land. Apartments are more uniform and are therefore easier to compare. The valuation of land is more complex and is dependent on the personal view of the appraiser. This can also lead to bias.
- There is almost no rental market for land and it is very limited for houses in Tokyo. There is however a large apartment rental market and so the same methodology can be used for measuring rents. As a result the rental ratio can be calculated very accurately as it is calculated on the same properties.
- Most indexes of cities around the world are based on apartment prices and not on land prices. Measuring apartments in Tokyo makes international comparison easier.
Houses in Japan normally depreciate completely within 20 to 30 years. House prices therefore reflect land value closely. Measuring house prices therefore suffers from the same disadvantages as measuring land prices.
Removal of Outliers
Listings with prices that are extremely outside the norm are automatically removed from the sample. Points with a square meter price more than 5 times higher or less than 5 times lower than average for their age are discarded.
Correction for Age
The average age of an apartment in Tokyo is not constant. The amount of construction fluctuates and as a result during boom times more new apartments come on the market than usual
In the above chart you can see that the average age of an apartment for sale has slowly declined from 2005 and only started rising recently.
As shown below on average new apartments are around 2 1/2 times more expensive than 30 year old ones. During boom times the average price of an apartment increases much more due to the newer units on the market.
To counter this effect the price of an average 20 year old unit is chosen. Between 2005 and 2010 this is about the average age of an apartment in the involved area is about 20 year. The calculate the value of an average 20 year apartment every day a quadratic regression is done on all the available apartments in the involved area. The 20 year point on resulting regression is taken.
Comparison of the ARE Index with the Land Institute of Japan
Every month the Land Institute of Japan brings out a
report on Japanese real estate prices. In that report they publish the average square meter prices for "Existing Condominium Sales in Tokyo Metropolitan Area".
The differences between those numbers and the ARE Index are:
- The Land Institute takes into account all wards of Tokyo, which includes sub-urban areas like Adachi-ku and Nerima-ku. Prices in those areas move in a different pattern from the inner-city.
- The Land Institute calculates their numbers based on only the reported transactions. This is likely only around 10 to 20% of the total. The ARE Index takes into account all apartments on the market.
- The Land Institute does not filter out the effect of the average age. As a result it over-reported the price increases for all of Tokyo in 2006 and 2007 when many new buildings came on the market.
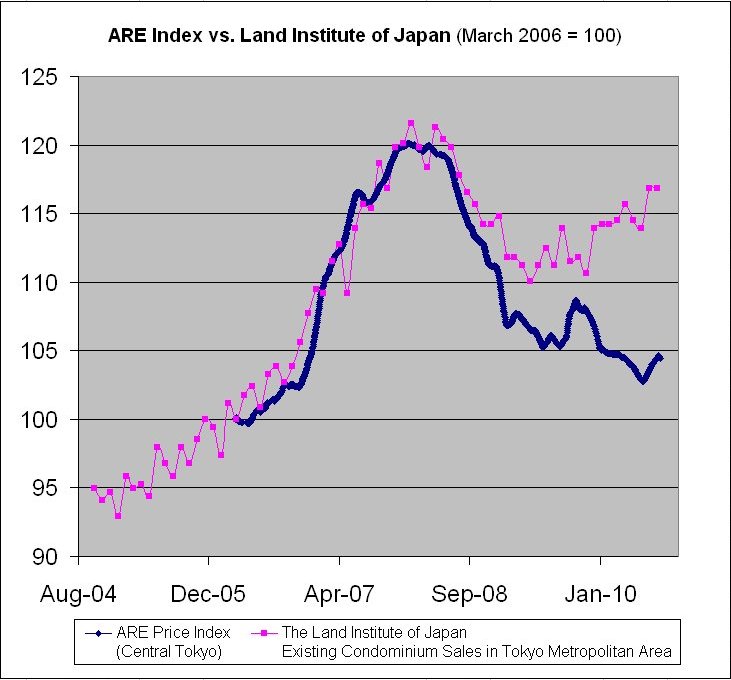
From the chart it is clear the two indexes reported similar gains in 2007 and 2007. Even though the Land Institute over-reported the price increases in all of Tokyo, the overall numbers are comparable as the sub-urban areas did not increase so much. But around 2008 the indexes started to diverge. While the sub-urban areas were not so affected by the financial crisis, central Tokyo prices declined rapidly. At the same time the average age of the apartments stabilized as new construction was halted. Given that the Land Institute includes the sub-urban areas the difference between the two indexes became pronounced.
Even with their differences both numbers though however are superior indicators compared to the Land Price statistics that are commonly reported internationally.
IPD Recruit Residential Price Index (RRPI)
This is a transaction price-based investment index using a hedonic regression. Factors considered in the RRPI calculation:
- Floor space
- Minute to the nearest station
- Accessibility measured by minutes by train to the nearest train terminal
- Building age
- Balcony space
- Number of units in building
- Other characteristics
It gives final asking prices in magazines or online prices in magazines or online, according to the RRPI description . It is monthly, and uses hedonic regression. An Excel file is available
here.
The resulting numbers seem reasonably correct. Compared to the ARE Index there is about a 3-4 month lag, clearly noticeable after the March 11 Earthquake. This index covers all of Tokyo so the price decline in 2011 is not as great as reported in the ARE Index, which covers just the central wards.