In any case, there are two interesting articles here; first one is empirical evidence that the CAPE is a very strong predictor of performance in the next 20 years. It is however a very poor predictor of short term performance.
Second article is about regeneration. I always wondered how councils manage to reclaim the homes from leaseholders, regardless if you are a tenant or owner via leasehold. I have no doubts that East London will be like Manhattan in 10 years' time, with modern skyscrapers and luxury apartments. In the meantime there could be some over supply in the borough. However, as London is perpetually undersupplied by close to 10 - 15k of new homes per year, people who live in the far flung west of London will eventually move towards the East.
The existing residents in Tower Hamlet councils will eventually be displaced to outer London and even outside of it. It makes sense that people on the dole should have no say about where they live, unless they can get themselves out of the rut and get back on the job ladder. Self help, with some state assistance, is the best form of social welfare.
This Graph Is The Reason My Current Cash Position Is 50 Percent
May 28, 2015 8:48 PM ET | 25 comments | Includes: DIA, QQQ, SPYby: Smart Owl Research
Disclosure: The author is long UN, WMT, NSRGY, JNJ. (More...)The author wrote this article themselves, and it expresses their own opinions. The author is not receiving compensation for it (other than from Seeking Alpha). The author has no business relationship with any company whose stock is mentioned in this article.
Summary
Most investors focus on the wrong variables when they put an investment portfolio together.
In this article, I will show that Shiller's Price Earnings Ratio (CAPE) is one of the few metrics that truly matter in investing. Nothing even comes close.
But CAPE has one (huge) shortcoming: the valuation metric only works for (real) patient investors. This is a problem in an investment world that only focuses on next quarter’s earnings.
Right now, Shiller's multiple indicates shares are overvalued and the S&P 500 is set to deliver real returns of a few percent in the next decade(s), at best.
My current cash position is about 50 percent. Although this could hurt me in the short run, I am patiently waiting for lower valuations to find more attractive entry points.
As a value investor, I am a terrible guest at birthday parties. In the (few) times other guests are interested in my profession - often hoping to get that ten bagger stock tip - I need to tell them stock markets are (probably) overvalued. On the contrary: when stocks are attractively priced after a crash, and I am optimistic about shares for valuation reasons, nobody has an interest in what I have to say.
This weekend, I told I was worried about high valuations at a birthday party. When my conversational partner asked how I could be so sure about this, I referred to the Nobel Laureate Robert Shiller who invented the cyclically adjusted price-earnings ratio (NYSEARCA:CAPE). Before I could finish my second sentence - "CAPE is the ratio of the current market price of all the S&P companies to the average inflation-adjusted profits of the ten preceding years" - I saw I was losing the interest of the other guest.
Quickly realizing I ran the risk of sipping on my beer in the kitchen alone the rest of the party, I switched to discussing the future of exciting new companies that are active in game-changing industries like 3-D printing, electric driverless cars and bio fuels (to be honest, I find it astonishing that some people seem to believe economists/analysts know just about anything about anything).
My audience grew even bigger when the subject changed to macro economics such as stories about the unproductive investment bonanza in China which resulted in ghost cities (see for instance this short documentary) or the creative ways in which Greece people evaded taxes (see anecdotal evidence here) and the likeliness the newly installed government can solve this problem.
Although exciting and fun, most of the stuff we talked about are close to useless if you want to predict future share returns. Fortunately, for the rest of the world, birthday celebrations are not meant to give lectures on sound stock advice. The bad news, however, is this observation also seems true for most of the sources investors get their information from. Think of the (breathless) opinions of talking heads on CNBC, the (constantly changing) economic/investment outlook of banks and most articles in financial newspapers.
Only look at the things that matter
In my view, there is only one thing that truly matters in investing: valuation. The price you pay for a financial asset is a huge determinant of the return an investor realizes. If markets are depressed and you pay a low price compared to earnings (low CAPE), it is likely an investor will harvest great returns, when the CAPE reverts to its long-run average (higher). When financial markets are exuberant (high CAPE), returns will most likely be poor as PEs need to fall back to their long-term average (lower).
In this article, I will analyze the historic relationship between CAPE and the returns of the S&P 500 for various holding periods (1-month and 1, 5, 10 and 20-year periods). The conclusion will be that CAPE has little predictive power in the short term, but has tremendous value for a patient long-term investor. In the end of the article, I will discuss the implications for investors.
I downloaded financial data that goes back to 1871 from professor Shiller's website (see here). As mentioned, to cyclically adjust earnings, Shiller averages profits of the last 10 years in the numerator of the ratio. Therefore, the sample I work starts ten years later in 1881.
I made a scatter plot in Excel to have a closer look at the relationship between CAPE and the monthly returns of S&P 500 since 1881. Note, CAPE adjusts profits for inflation, so I also adjust the returns for inflation. All returns I mention in this article are real total returns (including dividends).
Monthly scatter plot: No relationship between valuation and returns
(click to enlarge)
Each of the 1,612 dots represents a CAPE-figure in a specific month (between January 1881 and march 2014) and the subsequent monthly return of the S&P 500. Although the slope of the trend line in the graph is slightly positive, the line is flat from a purely statistical perspective. This means there is NO relationship between the CAPE and subsequent monthly returns.
Hurray, Hurray for proponents of the Efficient Market Theory. In the short run, stock returns are unpredictable and follow a random walk. Returns are similar to the footsteps of a drunk who staggers randomly around (you can't predict what his next step will be).
For the connoisseur, the R-squared - a statistical measure of how close the data fits the trend line - is almost zero, which tells that almost none of the variation in monthly returns is explained by the variation in CAPEs (an R-squared of 1 means metrics are perfectly correlated).
Let's stretch the return period with 11 months to one year and see what happens.
Annual return scatter plot: The slope turns negative, but I am not impressed
(click to enlarge)
Good news. As a value investor would expect, the slope turns negative, meaning the model predicts a lower return, albeit slightly, if you increase the CAPE. But I am not impressed: the magnitude of the slope is extremely small, and the model has barely explanatory power (R-squared is still close to zero). The cloud of dots clearly indicates dispersion is large.
Let's have a look if patience is rewarded and increase the holding period by four years to half a decade.
5-year scatter plot: Keeps getting better and better
(click to enlarge)
It seems patience is a virtue. The model fits the data better (R-squared jumps to 0,19) as the distance between the dots and the trend line diminishes. This is due to the fact that returns get compressed when you average them over longer time periods (fewer outliers). The range of returns is substantially higher in the 1-year return graph - roughly from the negative extreme of minus 90 percent to the positive extreme of plus 90 percent than in the five-year return graph - minus 15 percent to plus 30 percent. Obviously, the 5-year model has better predictive power than the 1-year model (again: R-squared is substantially higher).
The far left and far right side of the graph are in my view interesting. When the CAPE was extremely low or below 9, an investor very often realized a fabulous annual return in the five subsequent years since 1881, and never a negative one. In contrast: when shares are expensive - defined by a CAPE that is north of 31 - annual 5-year returns were mostly negative (some slightly positive).
A note of caution is needed here. One has to be careful with interpreting these statistics, as the number of data points is limited. Since 1881, only in 53 months the CAPE was north of 31, to be specific: this concerns months in 1929 and between 1997 and 2001. This represents a little more than 3 percent of all the data points. Nonetheless, it seems fair to say investors have to be careful when valuations are well-above average.
Let's jump to an investment period of 10 year and see what happens with the scatter plot.
10-year scatter plot: It is getting better and better
(click to enlarge)
The R-squared increases to over 0.3, meaning (the variation in) CAPE is getting better in explaining (the variation in) returns. Let's go to the final scatter plot that looks at 20-year return periods:
20-year scatter plot: About as good as it gets
(click to enlarge)
In the long run, value matters. With an impressive R-squared of 55 percent, this is about as good as it gets for an investor that wants to predict stock returns. The negative slope of the line clearly indicates returns diminish if valuation levels rise.
It is striking to me that all returns - except for one month in 1901 as 20 years later the S&P 500 hit its all-time low (average annual return over the 20 year period: minus 0.2 percent) - are positive. The annual returns over the 20-year investment period vary between minus 0,2 percent and 13 percent. This finding can be explained by the fact that in the very long run, the snowball effect of reinvesting dividends seems to outweigh the valuation effect (the mean reversion of the CAPE).
At first sight, this is great news for Buy-and-Hold Investors who always want exposure to the market and don't bother about valuations. However, even the biggest proponent of Buy-and-Hold investing must admit the returns at the right side of the graph look far from impressive: when CAPE was above 25 - which happened 14 times - the return in the subsequent 20 years was in all cases between 0 and 2 percent per annum. This return is less than a third of the long-run average return of the S&P 500 between 1871 and 2014 (6.2 percent).
Another way of looking at it
Instead of making a scatter plot, an investor can also calculate the average return of CAPE in a certain bracket. I computed the average returns when the CAPE was between 5 and 10, 10 and 15, 15 and 20... until the final bracket, a PE in excess of 35, for all the investment horizons (from 1 month to 20 years).
As a value investor, the results increased my heart pulse a bit as the table evidently shows looking at valuations is rewarding for patient investors. For every increase in CAPE-bracket within the 5, 10 and 20-year return horizon, the return diminishes. The only exception is the increase in CAPE from (20-25) to (25-30) over the ten-year horizon (due to relatively good returns of CAPE that are close to 25 in the (25-30) bracket).
Valuation is a great predictor of long-term stock returns
CAPE
Monthly returns
1 year returns
5 year returns
10 year returns
20 year returns
5-10
0.3%
11.6%
13.2%
10.6%
9.1%
10-15
4.9%
7.9%
6.7%
7.6%
7.7%
15-20
0.6%
3.8%
5.4%
5.7%
5.1%
20-25
0.6%
2.9%
5.0%
2.7%
3.0%
25-30
1.0%
3.5%
0.1%
3.9%
1.3%
30-35
0.7%
-0.9%
-1.1%
1.3%
0.6%
over 35
0.7%
-0.8%
-4.1%
-2.6%
no data points
*Source: Shiller's website. Returns are annualized.
The fact that CAPE does a great job predicting future returns implies one simple thing: valuations matter and markets are far from efficient. This is bad news for university professors who have been teaching the Efficient Market Hypothesis to students for several decades now. But this is terrible news for investors in the real world: given the current CAPE of 27.4, it seems unlikely investors will harvest decent returns - that is returns that are close to historical average - in the next decades.
Implications for an investor in 2015: What should your asset mix look like?
This article demonstrates shares are expensive from an absolute point of few, or compared to history. But the name of the investment game today is TINA - There Is No Alternative. Compared to other financial assets, or from a relative perspective, shares look fairly attractive.
This could be the case (although I am not convinced), but that still leaves me with the question why an investor would want to lock in low-single digit return for the S&P 500 in the next decades? At best. The fascinating thing about stock markets is that prices fluctuate on a daily basis. Sooner or later, I expect a correction, maybe after a rate hike, which will provide more attractive entry points for investors.
What does this imply from an asset allocation perspective? I can only tell what my personal asset mix looks like. I currently hold 50 percent of my wealth in cash and 50 percent in equities (no bonds). The equity part is mostly invested in Europe (better valuations) and emerging markets (much better valuations).
In the United States, my interest is limited to quality stocks which have their earnings protected by a huge moat such as Procter & Gamble (NYSE:PG), Johnson & Johnson (NYSE:JNJ) and Wal-Mart (NYSE:WMT). Let me be very clear: these shares are also overvalued. I am, however, less bothered by this. In my view, these companies will be able to generate returns above their earnings yield - the inverse of the P/E - because they can invest every dollar they retain out of profits in a very lucrative way.
I intend to write a piece about this magical property of these kinds of companies, but I used this the line of reasoning previous pieces on, for instance, Nestle (OTCPK:NSRGY) and Unilever (NYSE:UN).
Seeking Alpha's memory is everlasting. I will come back to you 5, 10 and 20 years from now to see if my assumptions were right - put simply: It will be not be different this time as well. In the meantime, I am hoping for a correction which leads to lower CAPEs and more attractive entry points to put the other half of my wealth at work.
‘The more deprived and edgy, the better’: the two sides of London’s property boom
The day after the election, the capital’s luxury flat market soared, as the global elite rushed to buy a piece of ‘real’ London life. Here, long-term residents and estate agents in one of Britain’s poorest inner-city boroughs count the cost
Estate agents David Campbell and Jessica Munday inside Telford Homes Penthouse, Avant Garde Tower, E1. Price: £3.5m. Photograph: Zed Nelson for the Guardian
In the hours after the Conservatives won a majority at the general election, London estate agents reported a surge in luxury property sales. Shares in Foxtons rose by 13%, and more than £100m of central London property was sold in a 24-hour frenzy, as estate agents worked through the night to deal with the renewed interest from wealthy buyers. Their fears over Labour’s proposed mansion tax had been allayed, and the tax loophole for non-doms had been preserved.
Meanwhile, there is a growing sense among those on low incomes that they are being pushed out of the capital. According to a recent Oxfam report, the five wealthiest families in the UK are richer than the poorest 20% of the entire population. Nowhere is this disparity more apparent than in Tower Hamlets, located at the heart of London’s East End, which has long been associated with some of the worst poverty in Britain. As many as 23% of families here live on less than £15,000 a year, and 53% of children come from families living on unemployment benefits. Tower Hamlets is also home to the towers of Canary Wharf, a hub of banking and commerce, making the borough one of the wealthiest parts of Britain, too. Its economy, worth more than £6bn a year, is greater than that of Monaco.
Luxury apartments are now selling for millions in Tower Hamlets. Estate agents, the foot soldiers of the housing boom, armed with shiny new catalogues, describe the area as “vibrant” and “edgy”. This is estate-agent speak for “visible signs of poverty nearby” – and it is accompanied by the tacit assumption that in a few years’ time the area will be completely gentrified. I talked to people on both sides of this wave of change, as a new, fully Conservative government takes shape.
Kabir Ahmed outside his flat, with two of his sons, Ishmael, 10, and Aakifah, two. Photograph: Zed Nelson for the Guardian I’ve lived on this estate since I was a small child. I live with my wife and three children; my parents are next door. As part of the 2006 transfer of council houses to housing associations, we felt positive about the provider EastendHomes taking over; they promised extensive refurbishments.
Now, they are talking about demolishing this estate and building a 25-storey tower, all private apartments, with 120 low-rise “affordable housing” units around it. The process would displace 600 residents. EastendHomes say they will resettle everyone, but there is a waiting list of 20,000 people in Tower Hamlets – so it could be outside the borough, or even London. We’re talking about 200 families effectively being forced out of the area – separated and rehoused in different places. They say that, when the new estate is finally built, they will offer us first refusal, but we would all be scattered by then – and how much of it would be genuinely affordable?
Half the people here are leasehold owners, who have bought their flats – including me. If it goes through, we would be offered “market value” for our homes; and if we refused, the developers could seek a compulsory purchase order.
The estate is valuable because we are just two or three minutes from the City of London. They can generate a lot of income from building private homes with social housing on the side.
EastendHomes argue that the buildings here are structurally unsound and uneconomical to refurbish, which we totally disagree with. It’s very frustrating. You hear the phrase “social cleansing” being used – and that’s exactly what this is.
Tom Griffin, partner, Cluttons residential sales; inside Cinnabar Wharf East, E1; sale price £5.75m
‘The Conservatives winning has taken away that unknown factor.’ Photograph: Zed Nelson for the Guardian Prior to the election, potential buyers were holding off their final decisions, waiting to see what would happen. The Conservatives winning has taken away that unknown factor, and the wealthy buyers’ fears of a Labour or coalition government’s effects on the greater economy.
This apartment – where it is, with the views it has – is unaffected by the issue of it being in Tower Hamlets, a traditionally poorer borough. Wapping is close to the city, it has fantastic views. The area represents good value for money for a very central location, with potential for growth above and beyond what the London market generally offers. There are a lot of people now seriously considering it.
Amy Berry, with her son, Robert, three, Tower Hamlets
‘No one can live near their families any more’. Photograph: Zed Nelson for the Guardian I was living in Poplar with my two children when I got pregnant with twins. Suddenly I had four kids, but the council wouldn’t rehouse me. My partner decided we should move to Essex, but that went wrong, and I found myself on my own, with serious personal problems, and four kids with health issues.
I begged my social worker to find me a home in Tower Hamlets. My mum’s lived here for 33 years. It’s good to be back, but I’m in a privately owned ex-council flat. It’s only temporary. There isn’t anything affordable. No one can live near their families any more.
Agents David Campbell and Jessica Munday, inside Telford Homes Penthouse, Avant Garde Tower, E1; sale price £3.5m
‘The property has doubled in value.’ Photograph: Zed Nelson for the Guardian David: Tower Hamlets has seen a wave of regeneration. Hackney is the golden child at the moment. Dalston became the coolest place in London. I almost think the more deprived and edgy the better. As soon as someone attaches the word “cool” to an area it stops being cool. Shoreditch changed from a gritty no-go area to being exceedingly trendy. Now it’s beginning to gentrify.
The market has changed phenomenally since 2011. We thought this property would be selling for £500 per square foot. Now, I’d say it’s £1,000 per square foot.
Julie Hicks, Tower Hamlets night shelter, The Good Shepherd Mission, Three Colts Lane, E2
‘I went to one women’s hostel. It looked like a prison, so I refused to go, and after that they told me I was on my own.’ Photograph: Zed Nelson for the Guardian I was given notice to leave my flat, and suddenly the bailiffs turned up. I’d been there five years. They changed the locks. Now it’s all done up and rented out to someone else. I had to take my pooch to Battersea, and I watched while they put him down. I had no choice.
The Citizens Advice Bureau found me hostel accommodation in E14. I was happy there, but they told me they were going to transfer me to Hopetown [a women’s hostel]. I went there and it looked like a prison, so I refused to go, and after that, they told me I was on my own. I became homeless. Finally I was referred here.
Mark Gallagher, Queen Victoria Seamen’s Rest hostel, E14
‘When I was 22 I was earning £15,000, but to rent privately cost me £900 per month.’ Photograph: Zed Nelson for the Guardian I left school at 16. When they built Canary Wharf, I got a job in the Tesco Metro. When I was 22, I was earning £15,000 a year, but to rent privately cost £900 a month.
I got made redundant and broke up with my girlfriend of 10 years. Things fell apart. I gave up my flat and spent three years on the street. I was drinking, smoking, and the missus wouldn’t let me see the kids. I was digging a hole for myself.
I’m living at the Seamen’s Rest now – it’s mainly for ex-servicemen and seamen, but it’s also for local people. The pressure got too much.
Mike Bickerton, head of new homes at DTZ; inside One Commercial Street, E1. 2,660 sq ft penthouse; sale price £4.25m
‘We have wealthy Chinese or Asian families who will put one of their kids in an apartment this size’. Photograph: Zed Nelson for the Guardian Go back four years and there wouldn’t have been much interest in Tower Hamlets. Now it’s trendy and vibrant, and you can walk to the Bank of England from here in 12 minutes. Tower Hamlets is one of London’s most deprived boroughs, but the area is smartening up and prices are rocketing. The local indigenous people are still there – we still have a jellied eel stand – but they’re surrounded by shiny glass and steel.
People like the edgy feel of east London, the “real London” feel: rich people living cheek by jowl with poor people. Parts of west London feel so safe and mundane.
Most overseas investors are looking for a good yield for renting, or buying apartments for their children. We have wealthy Chinese or Asian families who will put one of their kids in an apartment this size.
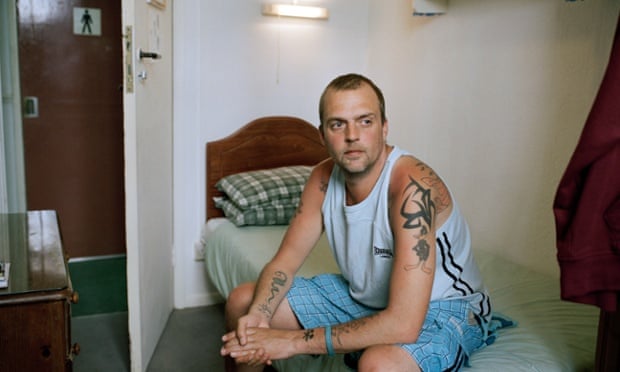
‘I work on the London underground… I hope I can stay here.’ Photograph: Zed Nelson for the Guardian I was 13 when I joined a gang. I got into violent situations. We protected our area, the other gangs protected theirs. When someone got hurt, there would be revenge attacks. It escalated – I’ve spent four years in prison, two years on remand, and had two convictions for GBH.
I’ve been working with City Gateway, a local charity, for just under a year now – training in dance and music. At nights I work on the London Underground as part of the repair and engineering team.
I hope I can stay in Tower Hamlets, but I won’t be able to if the prices go up. They’re putting up new flats, and making the area look nice; but they’re only considering the people who are well off, not the people who have been here for ages, and built a life for themselves.
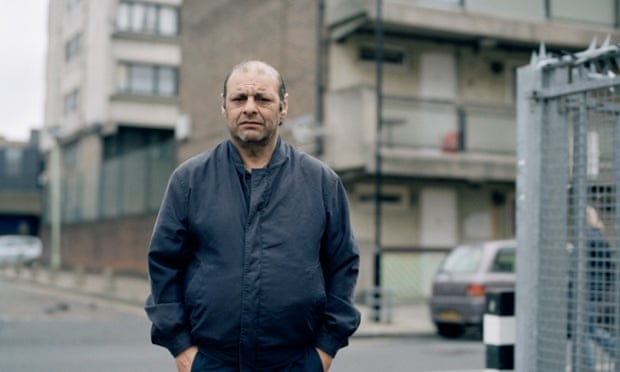
‘It’s changed too much around here. I’d like to move somewhere quiet, and where there’s a community.’ Photograph: Zed Nelson for the Guardian I was brought up in Tower Hamlets, all my family live here, but it’s hard to get a place here now. The new developments aren’t for us – you’ve got to have money to get those kind of places.
When I got married, we moved to Walthamstow. But it didn’t work out between us, and I lost my place. Last year, I was living in a bedsit in Tower Hamlets. I’d been there two years. Now I’m living all over the place. To get a new place, you need a deposit, and I haven’t got one. I’m on Jobseeker’s Allowance.
It’s changed too much around here. It’s hard to get a job, it’s hard to get a property. I’d like to move out of London, to somewhere like Felixstowe, where it’s quiet and there’s a community.