My take of the aftermath is as follows:
1. Interest rates of UST will rise, especially those between 5 and 10 years. UST prices will fall due to lack of support buying.
2. USD will rebound. I expect USDSGD to rise to 1.27 from 1.23. It will probably not surpass 1.30. It is a last chance saloon to exit. The cessation of printing of money will make this almost a sure thing.
3. What happens to stocks and commodities is unclear. It is likely that both will fall. After all, USD is a risk aversion currency and negatively correlated to risk assets. However, both have corrected between 10 - 20% since March 2011 so any further drop may be limited. I don't expect commodities to rise anytime between now and July.
4. China's economic slowdown is the biggest worry on commodities. The empty buildings in cities, the construction sector, which accounted for a large part of China's GDP grinding to a halt.
5. I don't like EURSGD as well. They are almost 100% sure to embark of QE.
6. I like GBP as their government has no choice but to hike rates very soon as they are facing stagflation.
7. I suspect gold does not have much upside. At least not for long because the EU will hike 3 more times and UK's rates have to rise. This leaves the US as the only DM that has not started to hike. The higher rates are, the more headwind for gold. I believe 1600 end 2011 is the highest it can reach.
8. VIX may rise after being so low for prolonged periods. Amundi Volatility World may be a strong performer in the next 3 months. I don't think trend following funds like Man AHL has much upside because few asset classes are trending.
9. Economic data from the US indicates a slowdown in economy.
Monday, 23 May 2011
End of QE 2. Nowhere to Hide
Identifying Counter Plays for the End of QE2
May 18, 2011 | Welcome to the Hedge Shack
The purpose of the Hedge Shack is to provide a place where counter-plays for the end of QE2 are identified, tracked, and discussed.
* The QE2 Counter-Play:
The end of Quantitative Easing Two (QE2) will occur at the end of June 2011. This article is designed to provide an area for focused discussions about the design of counter-plays for a potential sharp reduction in equity valuations.
* Why would the end of QE2 cause a sharp reduction in equity valuation? In other words, how does QE2 work?
Quantitative easing is a monetary policy used by the Fed to stimulate the US economy. The Fed buys government bonds and other financial assets with new money that the Fed creates (out of thin air), thus increasing the money supply and reserves of the banking system. This action raises the prices of the financial assets bought, which lowers their yield.
As the Fed systematically purchases a substantial volume of long-term Treasury bonds and other financial assets (i.e., equities), large financial institutions (i.e., bondholders) shift their wealth into equities to achieve a higher return. In other words, the Fed's actions reduce risk in the equities market which makes equities a more sensible investment than bonds. So, simply put, the Fed puts large quantities of money into the markets, inflating the price of equities. Money follows money, and up the market goes.
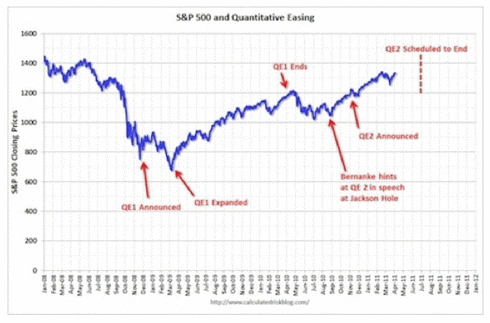
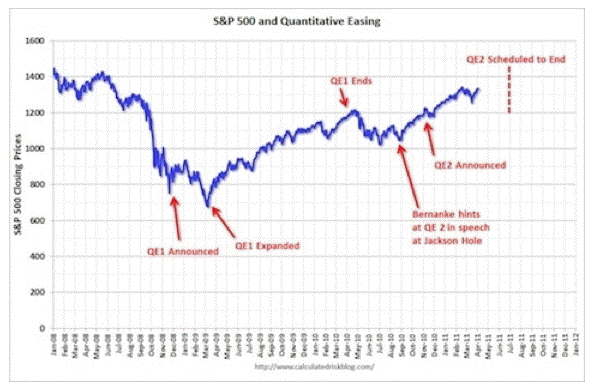
The resulting rise in equity prices increases household wealth, providing a boost to consumer spending. Figure One clearly demonstrates the effect of quantitative easing.
Figure One
click to enlarge
Of course, a few data points do not constitute absolute proof that quantitative easing is causal to a stock-market rise, or that stock-market increases cause increases in consumer spending.
However, the timing of the stock-market rise, and the lack of any other reason for a sharp rise in consumer spending, makes that chain of events look very plausible. Figure One shows us that shortly after QE1 was announced, the market free fall began to stabilize. After the QE1 program was expanded from 600b to 1.725 trillion, the market sharply reversed. When QE1 ended, the market once again reversed with about a 20% drop. That’s 200 S&P points (2,000 Dow points) over a two month time period.
QE2 was then suggested, and the market reversed. At the moment of decision, the market hesitated, then QE2 was announced, and once again, the market sharply increased. The time line of these events is perhaps more clearly demonstrated in Figure Two.
Figure Two
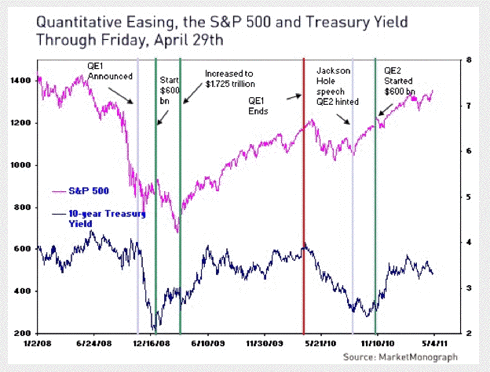
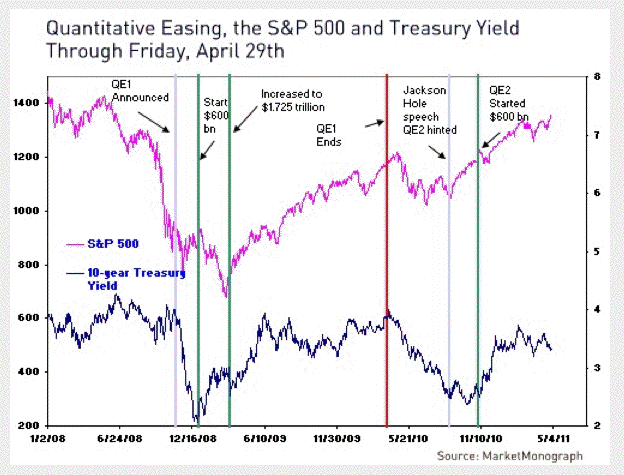
Note that as the Fed buys Treasures, the yield stabilizes at about 3.5%. Figure Three demonstrates a clear association between the Fed purchases and commodity prices.
Figure Three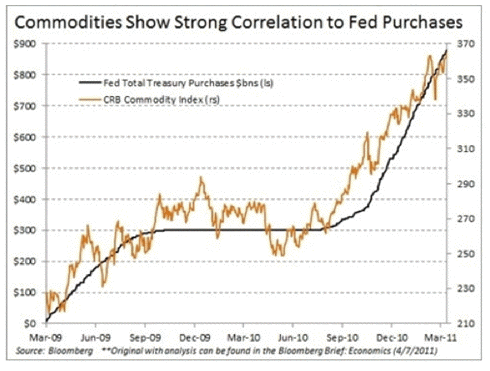
* Consumer Spending and Increases in Share Prices:
Note - the source for this section is based on a published interview with Martin Feldstein, Professor at Harvard.
Historically, the association between wealth and consumer spending implies that each $100 of incremental wealth raises consumer spending by about four dollars, so $2.5 trillion of additional wealth would be expected to raise consumer spending by roughly $100 billion. That figure matches closely with a drop in household saving and the resulting increase in consumer spending.
Since US households’ after-tax income totals $11.4 trillion, an one-percentage-point fall in the saving rate means a decline of saving and a corresponding rise in consumer spending of $114 billion – very close to the rise in consumer spending implied by the increased wealth that resulted from the gain in share prices.
None of this appears to augur well for 2011. There is no reason to expect the stock market to keep rising at the rapid pace of 2010. Quantitative easing is scheduled to end in June 2011, and the Fed is not expected to continue its massive purchases of Treasury bonds after that.
Without increases in stock-market wealth, will the savings rate continue to decline and the pace of consumer spending continue to rise more rapidly than GDP?
Will the strong economic growth at the end of 2010 be enough to propel more spending by households and businesses in 2011, even though house prices continue to fall and the labor market remains weak? And does artificial support for the bond market and equities mean that we are looking at asset-price bubbles that may come to an end before the year is over?
* The Hedge Shack:
So what does the investor do? Based on what happened at the end of QE1, it appears we can anticipate a 15% to 20% drop in the overall market. Are their any market sectors that would provide safety?
The following series of charts shows what happened to Oil and Gas, Technology, Semi-Conductors, Industries, Materials, Consumer Services, Utilities, Health Care, Metals and Mining, and gold during the period of time when QE1 ended and QE2 started.
NOWHERE TO RUN, NOWHERE TO HIDE.
Figure Four: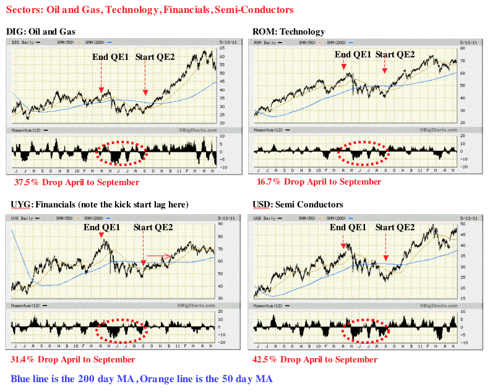
Figure Five
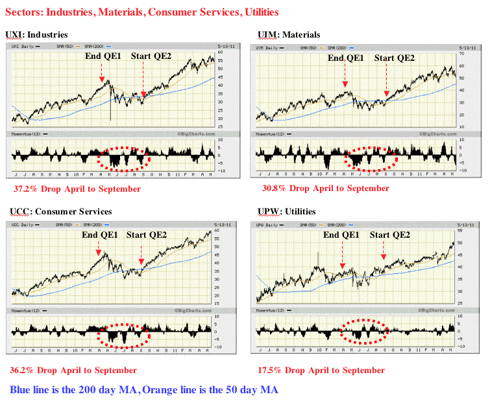
Figure Six
* Summary - Death Crosses!:
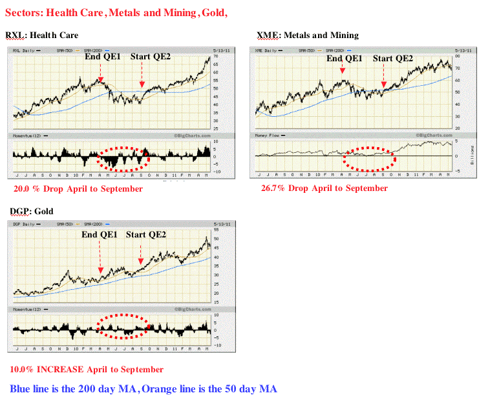
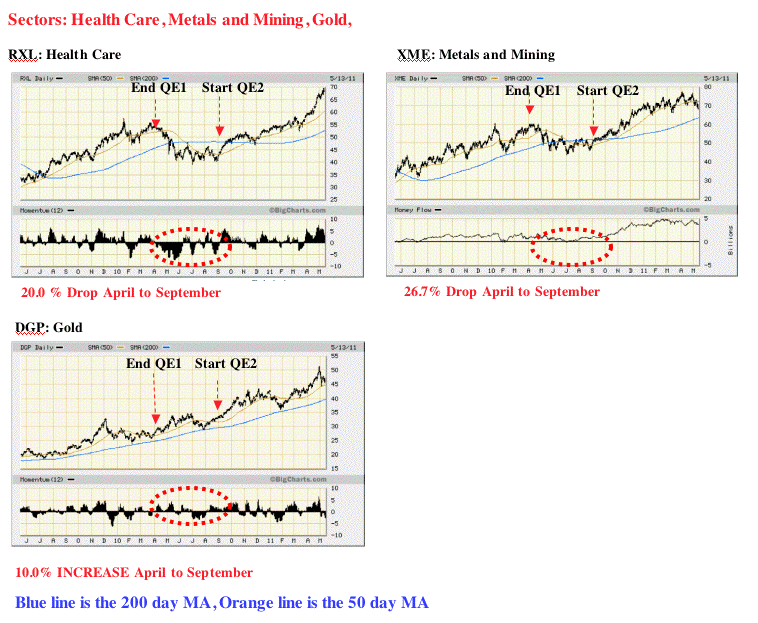
Looking at the eleven sectors I charted, ten of the eleven exhibited a death cross (50 day MA drops below 200 day MA) after QE1 expired. Those death crosses converted to golden crosses (50 day MA crosses the 200 day MA from below) after QE2 started. As a result, the utilization of the gap between the 50 day MA and the 200 day MA should provide a rough estimate of the expected drop in equities when QE2 ends. In fact, since the market tends to lead predicted events, it would not be surprising to see the market start to drop in Mid May.
The only chart that appeared to provide some degree of protection was gold. This was expected since the Fed is basically printing money during quantitative easing. As a result, the price of gold in US dollars would be expected to rise.
* Speculative Pressure And The Precious Metals Hedge:
Unfortunately, gold does not provide a level of absolute protection because its price can be actively manipulated by COMEX through modification of margin requirements - a strategy we are all too familiar with. It was because of this active manipulation and the special circumstances associated with silver that led me to not include a silver chart. Interference in the precious metals market by COMEX adds another unknown variable into the equation. The latter raises questions as to what forces are actually in play with respect to COMEX actions.
By the way, what does a coming margin hike look like? One of the main things professional traders watch for are daily price fluctuations. A big spread between a day’s highs and lows may be a sign the exchange is about to step in with higher margin standards.
* A US Dollar Hedge:
I was interested in whether investments in the US dollar might serve as one kind of hedge play. Figure Seven demonstrates what happened to three different kinds of US dollar hedge plays. Clearly, investments in the dollar did indeed increase at the end of QE1. Those increases appear to have been anticipated by four months prior to the end of QE1. A close examination of Figure Seven reveals that the US dollar plays have all started to increase at the start of May.
It appears that the double leverage US dollar (RYSDX) might be one of the better hedges against the end of QE2. However, caution is advised. The currency markets appear to be quite sensitive to anticipated moves by the Fed. I suggest this is the reason why the US dollar investments started to decline three months before the end of QE1.
Figure Seven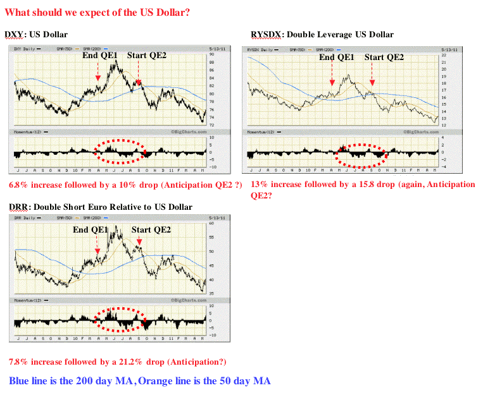
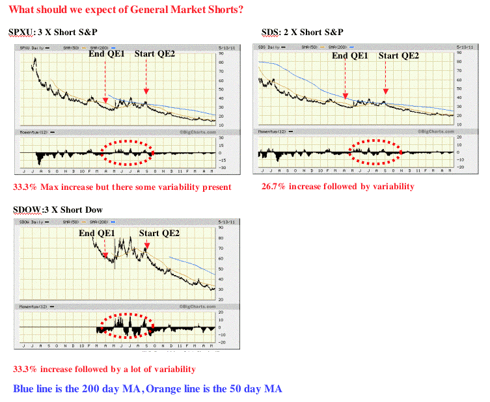
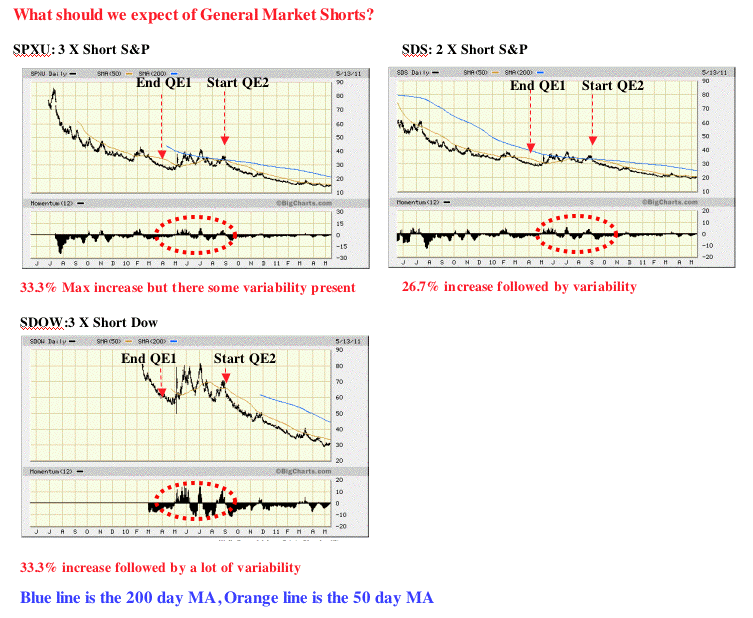
Figure Eight demonstrates that leveraged general market shorts appear to be a good way to hedge the end of quantitative easing. However, notice the high degree of variability present. Is this due to investors looking at the technical charts, or is something else happening? If a leveraged market short is used, the investor needs to be cautious.
Figure Eight
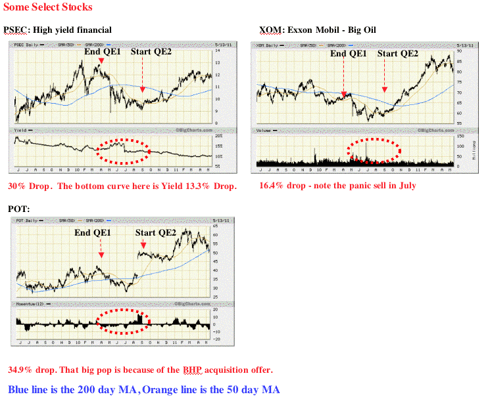
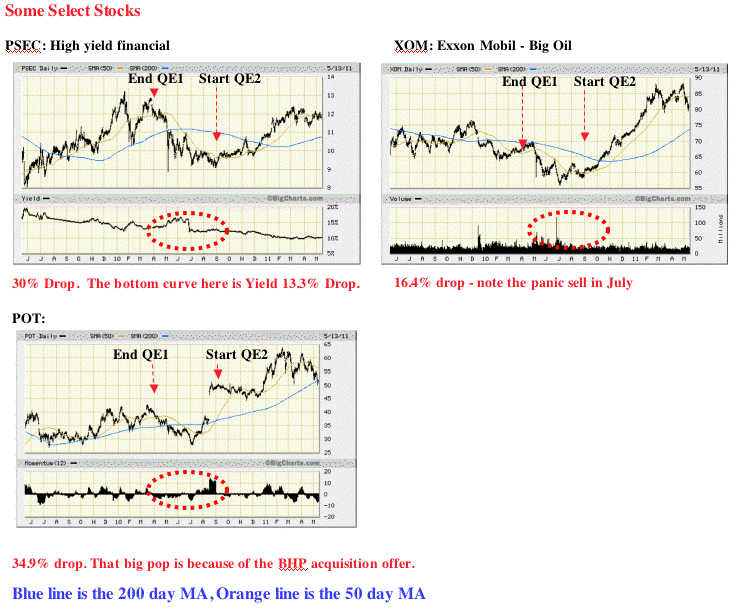
In Figure Nine, I looked at a few individual stocks. I will add more of these as requested. The first surprise was the performance of PSEC, a high yield return financial stock. I suppose I should not have been surprised given the performance of the Financial Sector. PSEC's valuation not only decreased by nearly one-third, its yield dropped by 13.3%. So high yield stocks are not necessarily a good hedge. PSEC's high yield at 15% has not recovered to this day.
While the oil and gas sector dropped by 37.5%, XOM dropped by about half of that (16.4%). It's likely that more speculative oil and gas holdings (i.e., high beta) suffer larger drops. If anyone is interested in that issue, I will look into it.
POT dropped by 34.9%. I was interested in POT because I wanted to see if a special catalyst (i.e. acquisition attempt) would override the loss of quantitative easing effect. The answer is a resounding yes. So special catalysts can still move the needle substantially even if the general market is falling.
Figure Nine
Disclosure: I am long UUP.
The purpose of the Hedge Shack is to provide a place where counter-plays for the end of QE2 are identified, tracked, and discussed.
* The QE2 Counter-Play:
The end of Quantitative Easing Two (QE2) will occur at the end of June 2011. This article is designed to provide an area for focused discussions about the design of counter-plays for a potential sharp reduction in equity valuations.
* Why would the end of QE2 cause a sharp reduction in equity valuation? In other words, how does QE2 work?
Quantitative easing is a monetary policy used by the Fed to stimulate the US economy. The Fed buys government bonds and other financial assets with new money that the Fed creates (out of thin air), thus increasing the money supply and reserves of the banking system. This action raises the prices of the financial assets bought, which lowers their yield.
As the Fed systematically purchases a substantial volume of long-term Treasury bonds and other financial assets (i.e., equities), large financial institutions (i.e., bondholders) shift their wealth into equities to achieve a higher return. In other words, the Fed's actions reduce risk in the equities market which makes equities a more sensible investment than bonds. So, simply put, the Fed puts large quantities of money into the markets, inflating the price of equities. Money follows money, and up the market goes.
The resulting rise in equity prices increases household wealth, providing a boost to consumer spending. Figure One clearly demonstrates the effect of quantitative easing.
Figure One
click to enlarge
Of course, a few data points do not constitute absolute proof that quantitative easing is causal to a stock-market rise, or that stock-market increases cause increases in consumer spending.
However, the timing of the stock-market rise, and the lack of any other reason for a sharp rise in consumer spending, makes that chain of events look very plausible. Figure One shows us that shortly after QE1 was announced, the market free fall began to stabilize. After the QE1 program was expanded from 600b to 1.725 trillion, the market sharply reversed. When QE1 ended, the market once again reversed with about a 20% drop. That’s 200 S&P points (2,000 Dow points) over a two month time period.
QE2 was then suggested, and the market reversed. At the moment of decision, the market hesitated, then QE2 was announced, and once again, the market sharply increased. The time line of these events is perhaps more clearly demonstrated in Figure Two.
Figure Two
Note that as the Fed buys Treasures, the yield stabilizes at about 3.5%. Figure Three demonstrates a clear association between the Fed purchases and commodity prices.
Figure Three
* Consumer Spending and Increases in Share Prices:
Note - the source for this section is based on a published interview with Martin Feldstein, Professor at Harvard.
The magnitude of the relationship between the stock-market rise and increases in consumer spending also fit the data. Share ownership (including mutual funds) of American households totals approximately $17 trillion. So a 15% rise in share prices increased household wealth by about $2.5 trillion.Relationship Between Wealth and Consumer Spending:
Historically, the association between wealth and consumer spending implies that each $100 of incremental wealth raises consumer spending by about four dollars, so $2.5 trillion of additional wealth would be expected to raise consumer spending by roughly $100 billion. That figure matches closely with a drop in household saving and the resulting increase in consumer spending.
Since US households’ after-tax income totals $11.4 trillion, an one-percentage-point fall in the saving rate means a decline of saving and a corresponding rise in consumer spending of $114 billion – very close to the rise in consumer spending implied by the increased wealth that resulted from the gain in share prices.
None of this appears to augur well for 2011. There is no reason to expect the stock market to keep rising at the rapid pace of 2010. Quantitative easing is scheduled to end in June 2011, and the Fed is not expected to continue its massive purchases of Treasury bonds after that.
Without increases in stock-market wealth, will the savings rate continue to decline and the pace of consumer spending continue to rise more rapidly than GDP?
Will the strong economic growth at the end of 2010 be enough to propel more spending by households and businesses in 2011, even though house prices continue to fall and the labor market remains weak? And does artificial support for the bond market and equities mean that we are looking at asset-price bubbles that may come to an end before the year is over?
* The Hedge Shack:
So what does the investor do? Based on what happened at the end of QE1, it appears we can anticipate a 15% to 20% drop in the overall market. Are their any market sectors that would provide safety?
The following series of charts shows what happened to Oil and Gas, Technology, Semi-Conductors, Industries, Materials, Consumer Services, Utilities, Health Care, Metals and Mining, and gold during the period of time when QE1 ended and QE2 started.
NOWHERE TO RUN, NOWHERE TO HIDE.
Figure Four:
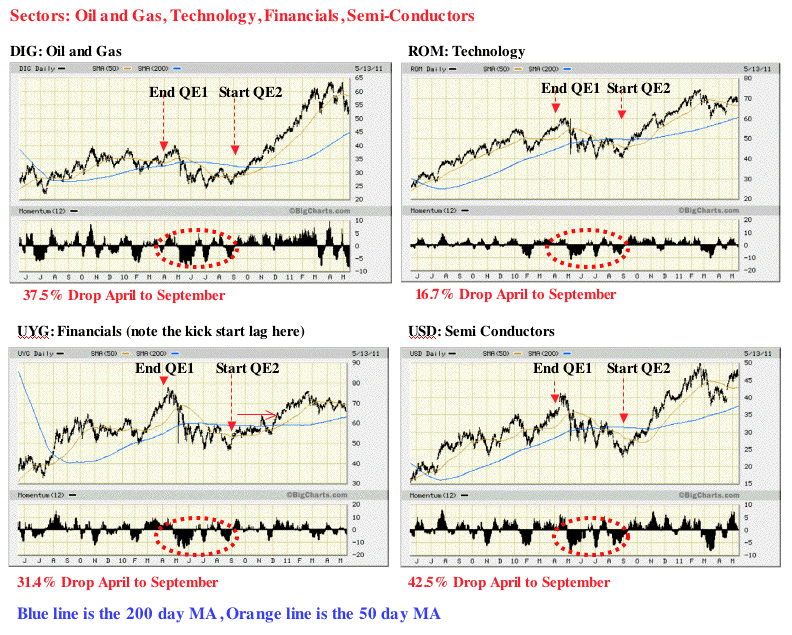
Figure Five
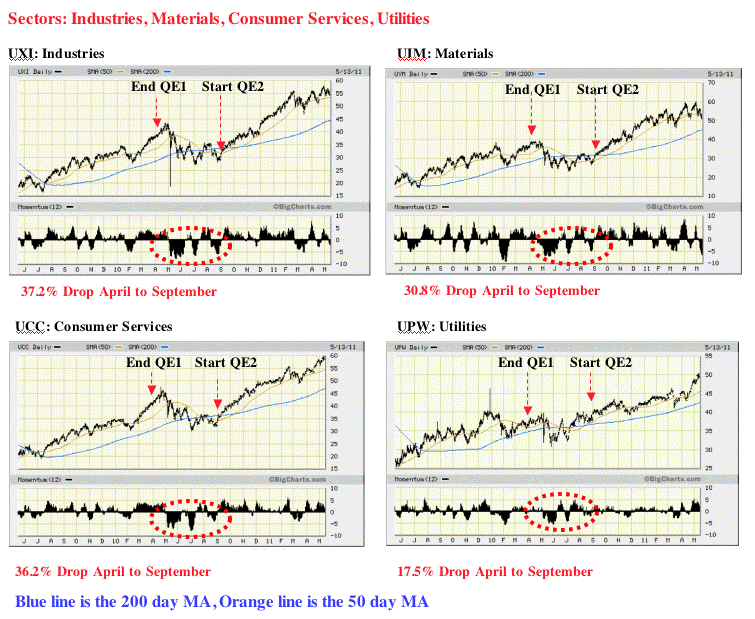
Figure Six
* Summary - Death Crosses!:
Looking at the eleven sectors I charted, ten of the eleven exhibited a death cross (50 day MA drops below 200 day MA) after QE1 expired. Those death crosses converted to golden crosses (50 day MA crosses the 200 day MA from below) after QE2 started. As a result, the utilization of the gap between the 50 day MA and the 200 day MA should provide a rough estimate of the expected drop in equities when QE2 ends. In fact, since the market tends to lead predicted events, it would not be surprising to see the market start to drop in Mid May.
The only chart that appeared to provide some degree of protection was gold. This was expected since the Fed is basically printing money during quantitative easing. As a result, the price of gold in US dollars would be expected to rise.
* Speculative Pressure And The Precious Metals Hedge:
Unfortunately, gold does not provide a level of absolute protection because its price can be actively manipulated by COMEX through modification of margin requirements - a strategy we are all too familiar with. It was because of this active manipulation and the special circumstances associated with silver that led me to not include a silver chart. Interference in the precious metals market by COMEX adds another unknown variable into the equation. The latter raises questions as to what forces are actually in play with respect to COMEX actions.
By the way, what does a coming margin hike look like? One of the main things professional traders watch for are daily price fluctuations. A big spread between a day’s highs and lows may be a sign the exchange is about to step in with higher margin standards.
* A US Dollar Hedge:
I was interested in whether investments in the US dollar might serve as one kind of hedge play. Figure Seven demonstrates what happened to three different kinds of US dollar hedge plays. Clearly, investments in the dollar did indeed increase at the end of QE1. Those increases appear to have been anticipated by four months prior to the end of QE1. A close examination of Figure Seven reveals that the US dollar plays have all started to increase at the start of May.
It appears that the double leverage US dollar (RYSDX) might be one of the better hedges against the end of QE2. However, caution is advised. The currency markets appear to be quite sensitive to anticipated moves by the Fed. I suggest this is the reason why the US dollar investments started to decline three months before the end of QE1.
Figure Seven
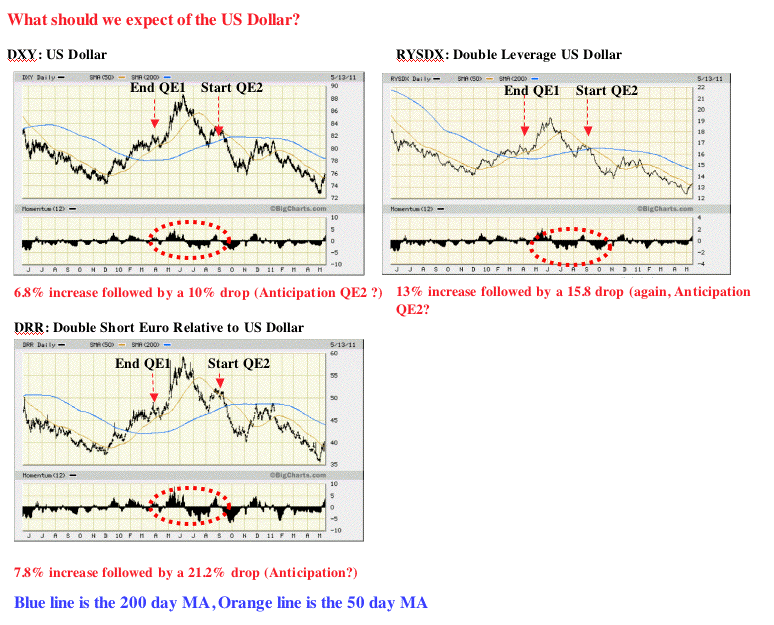
Figure Eight demonstrates that leveraged general market shorts appear to be a good way to hedge the end of quantitative easing. However, notice the high degree of variability present. Is this due to investors looking at the technical charts, or is something else happening? If a leveraged market short is used, the investor needs to be cautious.
Figure Eight
In Figure Nine, I looked at a few individual stocks. I will add more of these as requested. The first surprise was the performance of PSEC, a high yield return financial stock. I suppose I should not have been surprised given the performance of the Financial Sector. PSEC's valuation not only decreased by nearly one-third, its yield dropped by 13.3%. So high yield stocks are not necessarily a good hedge. PSEC's high yield at 15% has not recovered to this day.
While the oil and gas sector dropped by 37.5%, XOM dropped by about half of that (16.4%). It's likely that more speculative oil and gas holdings (i.e., high beta) suffer larger drops. If anyone is interested in that issue, I will look into it.
POT dropped by 34.9%. I was interested in POT because I wanted to see if a special catalyst (i.e. acquisition attempt) would override the loss of quantitative easing effect. The answer is a resounding yes. So special catalysts can still move the needle substantially even if the general market is falling.
Figure Nine
Disclosure: I am long UUP.
Rare Earths: Has the Thesis Changed?
Rare Earths: Has the Thesis Changed?
| May 20, 2011
Recently, we have seen a pullback in the price and valuation of "rare earth" companies.
[Click to enlarge]
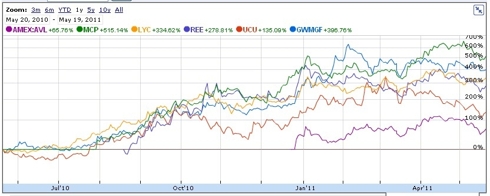
Is this pullback signalling overvaluation, changes in demand or just a breather from the massive run-up of the companies?
As I have stated in previous articles on SA, I believe that there is a valid longer term thesis that supports current (and higher) valuations of these companies. While Japanese demand may have slipped due to the tragic events in March, this is a temporary setback. Demand will continue to increase as more countries attempt to secure RE stockpiles (especially those rare earth elements/minerals produced outside China).
One example of this is The Fiscal Year 2012 National Defense Authorization bill (H.R. 1540) that was passed by the House Armed Services Committee included a provision that will require the Defense Logistics Agency Strategic Materials (formerly the Defense National Stockpile Center) to develop a plan to establish an inventory of rare earth oxides, metals, alloys, and magnets for defense purposes. Specifically:
Impediments to thesis:
[Click to enlarge]

Is this pullback signalling overvaluation, changes in demand or just a breather from the massive run-up of the companies?
As I have stated in previous articles on SA, I believe that there is a valid longer term thesis that supports current (and higher) valuations of these companies. While Japanese demand may have slipped due to the tragic events in March, this is a temporary setback. Demand will continue to increase as more countries attempt to secure RE stockpiles (especially those rare earth elements/minerals produced outside China).
One example of this is The Fiscal Year 2012 National Defense Authorization bill (H.R. 1540) that was passed by the House Armed Services Committee included a provision that will require the Defense Logistics Agency Strategic Materials (formerly the Defense National Stockpile Center) to develop a plan to establish an inventory of rare earth oxides, metals, alloys, and magnets for defense purposes. Specifically:
What kicked off the opportunity was China tightening quotas on rare earths. Well, it's at it again. From the Australian):SEC. 835. RARE EARTH MATERIAL INVENTORY PLAN.(a) REQUIREMENT. — Not later than 180 days after the date of the enactment of this Act, the Administrator of the Defense Logistics Agency Strategic Materials shall submit to the Secretary of Defense a plan to establish an inventory of rare earth materials necessary to ensure the long-term availability of such rare earth materials, as identified by the report required by section 843 of the Ike Skelton National Defense Authorization Act for Fiscal Year 2011 (Pulic Law 111-383; 124 Stat. 4282) and as otherwise determined to be necessary. The plan shall — (1) identify and describe the steps necessary to create an inventory of rare earth materials, including oxides, metals, alloys, and magnets, to support national defense requirements and ensure reliable sources of such materials for defense purposes; (7) identify and describe the steps necessary to develop or maintain a competitive, multi-source supply-chain to avoid reliance on a single source of supply; (8) identify and describe supply sources considered by the Administrator to be reliable, including an analysis of the capabilities of such sources to produce such materials in forms required for military applications in the next five years, as well as the security of upstream supply for these sources of material ...
China said today it would expand export quotas for rare earths to include iron alloys containing the elements, further tightening shipments of the minerals used in a variety of high-tech industries.And in addition, this:
From tomorrow, iron alloys containing more than 10 per cent of rare earths by weight will fall under the export quota system, the commerce ministry said in a statement.
The ministry said the move would "more effectively protect the exhaustible materials and the environment."
China has previously imposed export quotas for pure rare earths only -- 17 elements critical to manufacturing everything from iPods to low-emission cars, wind turbines and missiles.
The decision to include alloys into the existing quotas is expected to close loopholes by which exporters can sidestep current regulations, thereby further reducing the amount of rare earth elements in the country's exports.
Earlier this month, Ernst & Young waded into the fray:China's State Council on Thursday issued a national guideline that aims to promote sustainable and healthy development of the country's rare earth industry.China will take effective measures to strengthen the management over the sector and speed up transforming the development pattern of the industry in order to protect and properly use rare earth resources, the guideline stated.
Special campaigns will be launched to crack down on illegal mining activities and excessive production, and greater efforts will be made to combat practices that pollute the environment and damage the ecology. The campaigns will also target illegal exports and smuggling of rare earths, the guideline said.
Specifics in Thursday's guideline also include efforts to implement greater order in rare earth exploration, smelting and extracting, and market distribution over the next one to two years.
During the period, industrial concentration will be improved as large companies will dominate in the sector, the guideline said.
Demand for rare-earth elements, used in hybrid cars, consumer electronics and wind turbines, could leap by 60% by 2016, Ernst & Young said on Wednesday.
Leader of the company’s mining practice in Quebec, Zahid Fazal, said that China, which accounts for over 95% of global production of the metals, will not be able to meet its own requirements from 2012 to 2015.
“We're already seeing companies crowd the market with new projects aimed to fill the estimated supply gap,” Fazal commented in a media release.
“But because these projects are risky, getting the right financing in place can be difficult, and we could see a fierce fight for cash in a limited investor pool.”
He added that there would likely be a “a race to the finish line” for company’s to get their projects into production and capitalise on the high prices.
“There is still time to develop a number of vertically integrated players in the heavy rare earth space where first mover advantage could generate real benefits,” said Ernst & Young.
Rare earth elements have also been making the news (both talking head and other). Normally, this makes me think the top is in place as a sector grabs media attention, but in this case, I still think there is room to go (although yes, CNBC dedicating a segment to it makes me wary).
From National Geographic:
On CNBC, there is a number of video clips with relevant CEOs. Bottom line of the videos:"We're in a supply crunch right now, and it's a pretty severe one," says Smith. "This year the demand will be 55,000 to 60,000 tons outside of China, and everyone's best guess right now is that China will be exporting about 24,000 tons of material. We'll survive because of industry inventories and government stockpiles, but I think 2011 will be a very, very critical year in terms of supply and demand."
- 2015 most mines should be coming on-line.
- Growth will continue as demand increases across products.
- More companies looking for offtake (India, Russia, Korea and China).
- Funding will be needed to continue capital spending.
Impediments to thesis:
- Limited facilities: Although rare earth metal prices are surging due to favorable demand conditions, there are currently no separation facilities for the all-important "heavy" rare earths outside of China, leaving North American explorers to struggle for revenues.
- Alternatives: The rare element neodymium is the most oft-mentioned threat to the electric-drive vehicle market. It's the magnet in so-called fixed-magnet motors, which make up the majority of motors used in modern battery-powered applications, including hybrids and EVs. Induction motors are distinct from fixed-magnet motors in that they use aluminum or copper conductors to create electromagnetic fields, without magnets. This in turn allows them to be manufactured sans rare earths.
- Increase in supply: Many of the companies involved in the rare earth space have projects coming on-line in/around 2015. When this happens, the supply/demand factor changes and mineral pricing should decrease.
Bottom line: I believe that rare earth companies still represent a good intermediate- to long-term investment due to continued restrictions on supply (in the near-term) and continued increase in demand. Yes, prices will moderate when more projects come on-line, but as this looks to take place in three to five years, there is still a supply/demand imbalance which favors current/increased pricing. I would also expect some of the larger players to embark on a "roll up" strategy in order to geographically diversify and realize the benefits of increased scale.Goldman Sachs analyst Malcolm Southwood, however, said the price boom is nearing its peak. The supply deficit will peak at 18,734 tons this year, equivalent to 13.2% of a forecast 141,524 tons of demand, before the market slips into a slight surplus in 2013, he said in the report published Thursday. The surplus will rise to 5,860 tons or 3.2% of projected demand in the following year, the report said.Initially, at least, prices will likely continue to rise, he said. The basket price for the Mount Weld rare earths should climb to $227 a kilogram next year, a gain of about 40%. Prices may eventually moderate to an average of $82 a kilogram, but that will happen only in 2015, the third consecutive year of a global surplus, the report said."We envisage a closely balanced market in 2013, and modest surpluses thereafter — at least, for some of the more abundant light rare earths — with some price softening in the 2013-2015 period," according to the report.
Subscribe to:
Posts (Atom)