Sunday 9 October 2011

Why I Think A Rebound of 10% or More May Occur

There were 4 big bear markets (> 30% drops) in the US; 1987, 2000, 2008 and now.

1987, the fall of 36% occured within 3 trading days. It took about 3 years to recover the losses. Hence my theory is that stock markets fall more than 3 times faster than it rises. Even I would find it difficult to cut with minimal losses. I would have sold my stocks at around 20% down at best.


2000 - 2003:

The tech bubble took a long time to unfold. From the peak some time in Jan 2000, the Dow and S&P500 fell by around Apr 2003. It took about 3.5 years to unfold with lots of rebound. In fact by Aug 2001, the Dow fell from 12000 to 10500 and you still would not be sure if we are in a bear. However, the 150 D EMA of 10800 showed the Dow fluctuating between 12000 to 10500 for 1.75 years, around 12 - 13% trading range, alternating between bull and bear territories for sometime. This should be another warning to investors that stocks are in trouble. When 9/11 came, it was another 20% down. Another warning sign is the 150 D EMA dipping downwards. Never buy when this happens.

2008:

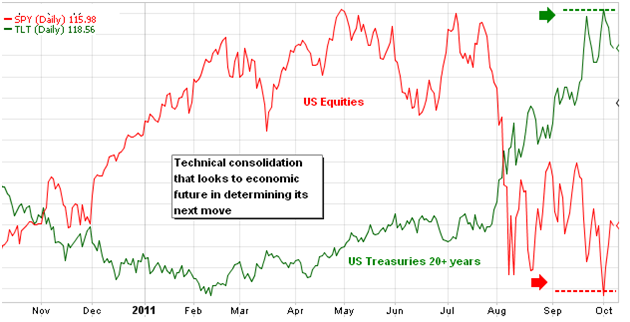
The last 4 years has been the age of financial crisis. Oct 2007 was the peak of the S&P500. 7 months later, there was a huge rebound to keep the downside from the peak at 10%. However, it was the last chance to exit. After May 2008, markets continued to trend lower before they capitulate in Oct 2008.

Conclusion:

My take is that we usually have better exit points for equities up to 7 to 8 months after the highest point. But if those chances are not taken, we could suffer huge falls. Our experience in 1987 showed that it could not be avoided because the crash took place over 3 days. But the crashes in 2000, 2008 and now will probably give us opportunities to exit with around 10% losses.

Get out early, get out on rebounds. If unsure, stay sidelined and do bonds, do CTAs.

We Are In a Bear That May Last Till Mid 2012

This is a post that I feel is helpful for those who still think we are not in a bear market and things are going to get a lot better. Most indices have pierced below the 200 Day Moving Averages and at high volume. I believe that it won't be a straight line down and there will be huge rebounds along the way. In my next post I'll show you some charts of a bear market unfolding.

My point is, there may be a rebound lasting until Dec 2011 and you may recover 10% from this low. So hang on there.


What The Euro Crisis Tells Us About Market Bottoms


With the coming of October and Q3, the markets are quickly approaching 2010 support levels. Looking at the last 12 months, equities both here and in Europe have seen declines that suggest a bear market.
With regards to the Europe 350 index, it has seen declines of 30.6% off of its 2011 highs. This is due in part to the poor response by their policy makers of handling the sovereign debt situation, as well as the uncertainty that holds much of the world captive at this point. The S&P 500, on the other hand, has seen a less pronounced loss compared to its European counterparts. The 18.6% decline witnessed earlier this month borders the 20% bear market threshold; however, it has not yet been breached.
The domestic situation concerning political dissonance and further dollar devaluation seems to have subsided somewhat, yet the global problems still remain. Regardless, over the past few days, the markets have spiked higher. The rationalization is not quite there, except that technical levels have rejected bear territory at this point, and there is still hope for a eurozone solution. We look to a longer-term comparison chart of the US and Europe to project future movement.


European equities have declined to the point that they now border their 2010 lows. US markets are not quite there, but they're close. Further economic and confidence deterioration should transition our current support levels to those of the 2010 lows. This would in essence mean we had, without question, entered a bear market.


The chart of the VIX above is a way of conveying the lack of confidence that still exists in markets today. Over the past few months the situations in question have had the veil pulled off to reveal the magnitude of their problems. Until structural change occurs, the markets should remain in this volatile state.
Lastly, an indicator that will in fact let us know that the markets have calmed is seen in the S&P 500/US Treasuries relationship. When the two can reverse direction together, and with conviction, more confidence should arise and volatility should decline.

Disclosure: I have no positions in any stocks mentioned, and no plans to initiate any positions within the next 72 hours.