Pop An Antacid Before Viewing These Economic Charts
It’s Friday again, which means it’s time for me to select a handful of graphics that put the most important economic and investment news into an easy-to-understand chart format for you.
This week… China’s effect on the global gold market, the U.S. housing market’s ongoing woes and a downright scary-looking chart regarding one of Europe’s biggest nations.
So let’s get to it…
China: The Land of Golden Speculation
About a month ago, I revealed a disturbing truth about silver’s rally.
I noted that that the primary driver behind the precious metal’s meteoric rise wasn’t economic supply and demand. Instead, it was rampant speculation, which made a correction inevitable.
Sure enough, that’s what happened – and we could be in store for a repeat performance… but this time, in the gold market.
For the first time ever, Chinese demand for gold outpaced the combined demand for gold in United States, France, Germany, Italy, Switzerland, the United Kingdom and other European countries.
The major driving force behind that surge? You guessed it… investment demand.
(Click charts to expand)
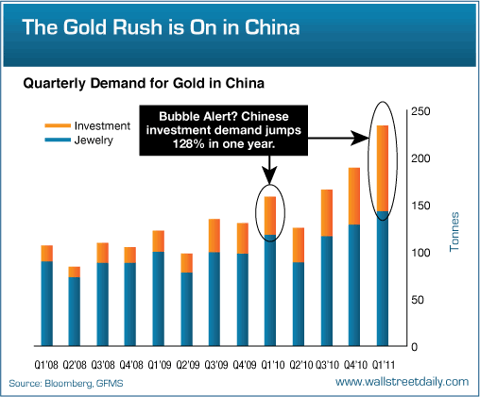
Over the past year alone, investment demand for gold in China more than doubled, according to the latest quarterly report from the World Gold Council.
If that doesn’t smack of rampant speculation, I don’t know what qualifies. And just like any other speculative bubble, when China’s appetite for gold investments wanes, get ready for a bumpy landing!
The State of the Housing Union: Depressing
In the light of some recent seemingly positive U.S. real estate statistics, I went to great lengths this week to put the news in perspective and show you that the housing market isn’t even close to being on the mend. (If you missed them, you can read Part 1 here and Part 2 here.)
But just in case the 12 statistics I highlighted didn’t convince you, this week’s update on new home sales from the Commerce Department should do the trick.
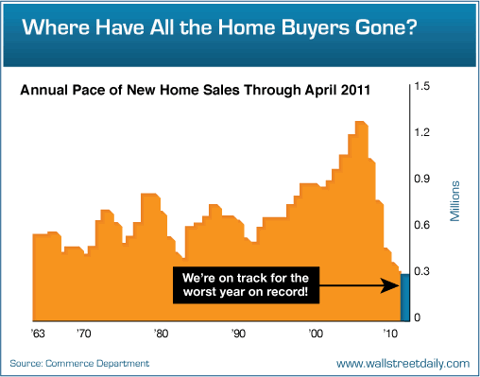
As you can see, we’re on pace for a sixth year of declines – and in jeopardy of hitting a record low. As for homebuilders – and homebuilding stocks – it’s safe to say they’re in store for another tough year..
Why Italy’s Debt Downgrade Scared the Crap Out of the Markets
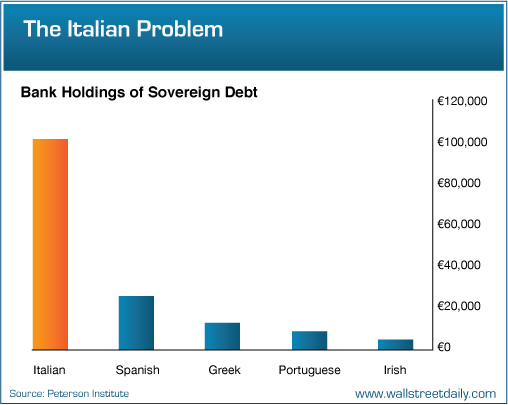
Last weekend, Standard & Poor’s downgraded Italy’s credit rating from “stable” to “negative.” The news immediately put the global markets on edge and initiated a three-day sell off.
So what’s the big deal? I mean, we’ve already endured sovereign debt crises and downgrades in Greece, Portugal and Ireland. Adding another European country to the list couldn’t be that bad, right?
Wrong!
As this chart shows, exposure to Italy’s debt by publicly traded banks dwarfs the other nations, meaning that a default would send shockwaves through a banking sector still on the mend.
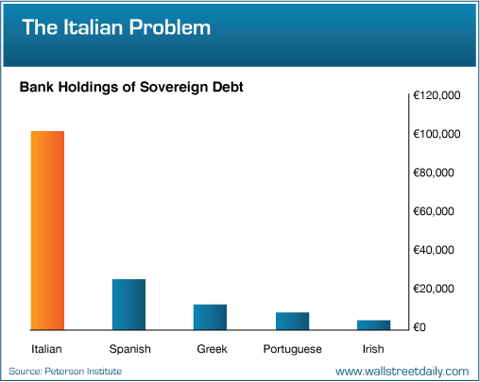
Now you know why investors didn’t just say, “Ah, forgetaboutit!”
This week… China’s effect on the global gold market, the U.S. housing market’s ongoing woes and a downright scary-looking chart regarding one of Europe’s biggest nations.
So let’s get to it…
China: The Land of Golden Speculation
About a month ago, I revealed a disturbing truth about silver’s rally.
I noted that that the primary driver behind the precious metal’s meteoric rise wasn’t economic supply and demand. Instead, it was rampant speculation, which made a correction inevitable.
Sure enough, that’s what happened – and we could be in store for a repeat performance… but this time, in the gold market.
For the first time ever, Chinese demand for gold outpaced the combined demand for gold in United States, France, Germany, Italy, Switzerland, the United Kingdom and other European countries.
The major driving force behind that surge? You guessed it… investment demand.
(Click charts to expand)

Over the past year alone, investment demand for gold in China more than doubled, according to the latest quarterly report from the World Gold Council.
If that doesn’t smack of rampant speculation, I don’t know what qualifies. And just like any other speculative bubble, when China’s appetite for gold investments wanes, get ready for a bumpy landing!
The State of the Housing Union: Depressing
In the light of some recent seemingly positive U.S. real estate statistics, I went to great lengths this week to put the news in perspective and show you that the housing market isn’t even close to being on the mend. (If you missed them, you can read Part 1 here and Part 2 here.)
But just in case the 12 statistics I highlighted didn’t convince you, this week’s update on new home sales from the Commerce Department should do the trick.

As you can see, we’re on pace for a sixth year of declines – and in jeopardy of hitting a record low. As for homebuilders – and homebuilding stocks – it’s safe to say they’re in store for another tough year..
Why Italy’s Debt Downgrade Scared the Crap Out of the Markets
Last weekend, Standard & Poor’s downgraded Italy’s credit rating from “stable” to “negative.” The news immediately put the global markets on edge and initiated a three-day sell off.
So what’s the big deal? I mean, we’ve already endured sovereign debt crises and downgrades in Greece, Portugal and Ireland. Adding another European country to the list couldn’t be that bad, right?
Wrong!
As this chart shows, exposure to Italy’s debt by publicly traded banks dwarfs the other nations, meaning that a default would send shockwaves through a banking sector still on the mend.
Now you know why investors didn’t just say, “Ah, forgetaboutit!”
No comments:
Post a Comment